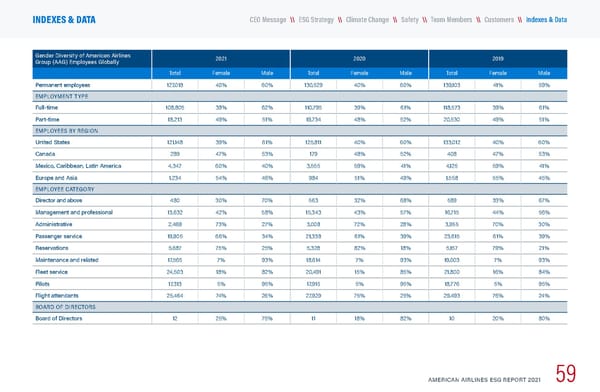
Gender Diversity of American Airlines Group (AAG) Employees Globally 2021 2020 2019 Total Female Male Total Female Male Total Female Male Permanent employees 127,018 40% 60% 130,529 40% 60% 139,103 41% 59% EMPLOYMENT TYPE Full-time 108,805 38% 62% 110,795 39% 61% 118,573 39% 61% Part-time 18,213 49% 51% 19,734 48% 52% 20,530 49% 51% EMPLOYEES BY REGION United States 121,148 39% 61% 125,811 40% 60% 133,012 40% 60% Canada 289 47% 53% 179 48% 52% 408 47% 53% Mexico, Caribbean, Latin America 4,347 60% 40% 3,555 59% 41% 4,125 59% 41% Europe and Asia 1,234 54% 46% 984 51% 49% 1,558 55% 45% EMPLOYEE CATEGORY Director and above 480 30% 70% 563 32% 68% 589 33% 67% Management and professional 13,632 42% 58% 15,343 43% 57% 16,715 44% 56% Administrative 2,469 73% 27% 3,008 72% 28% 3,955 70% 30% Passenger service 19,905 66% 34% 21,338 61% 39% 23,615 61% 39% Reservations 5,687 75% 25% 5,328 82% 18% 5,157 79% 21% Maintenance and related 17,565 7% 93% 18,614 7% 93% 19,003 7% 93% Fleet service 24,503 18% 82% 20,491 15% 85% 21,800 16% 84% Pilots 17,313 5% 95% 17,915 5% 95% 18,776 5% 95% Flight attendants 25,464 74% 26% 27,929 75% 25% 29,493 76% 24% BOARD OF DIRECTORS Board of Directors 12 25% 75% 11 18% 82% 10 20% 80% AMERICAN AIRLINES ESG REPORT 2021 59 \\ Customers \\ Team Members \\ Climate Change \\ Safety \\ ESG Strategy CEO Message INDEXES & DATA \\ Indexes & Data
 American Airlines ESG Report Page 59 Page 61