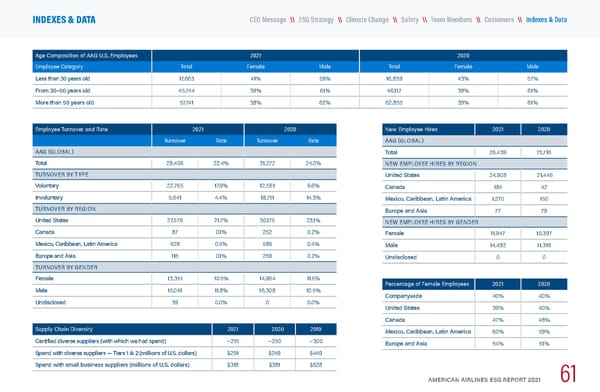
Age Composition of AAG U.S. Employees 2021 2020 Employee Category Total Female Male Total Female Male Less than 30 years old 17,663 41% 59% 16,839 43% 57% From 30–50 years old 45,744 39% 61% 46,117 39% 61% More than 50 years old 57,741 38% 62% 62,855 39% 61% Employee Turnover and Rate 2021 2020 Turnover Rate Turnover Rate AAG (GLOBAL) Total 28,406 22.4% 31,272 24.0% TURNOVER BY TYPE Voluntary 22,765 17.9% 12,561 9.6% Involuntary 5,641 4.4% 18,711 14.3% TURNOVER BY REGION United States 27,576 21.7% 30,175 23.1% Canada 87 0.1% 252 0.2% Mexico, Caribbean, Latin America 628 0.5% 586 0.4% Europe and Asia 115 0.1% 259 0.2% TURNOVER BY GENDER Female 13,351 10.5% 14,964 11.5% Male 15,016 11.8% 16,308 12.5% Undisclosed 39 0.0% 0 0.0% Supply Chain Diversity 2021 20 2020 2019 Certified diverse suppliers (with which we had spend) ~ 215 ~ 250 ~ 300 Spend with diverse suppliers — Tiers 1 & 2 (millions of U.S. dollars) $291 $249 $449 Spend with small business suppliers (millions of U.S. dollars) $318 $381 $628 New Employee Hires 2021 2020 AAG (GLOBAL) Total 26,439 21,716 NEW EMPLOYEE HIRES BY REGION United States 24,908 21,445 Canada 184 42 Mexico, Caribbean, Latin America 1,270 150 Europe and Asia 77 79 NEW EMPLOYEE HIRES BY GENDER Female 11,947 10,397 Male 14,492 11,319 Undisclosed 0 0 Percentage of Female Employees 2021 2020 Companywide 40% 40% United States 39% 40% Canada 47% 48% Mexico, Caribbean, Latin America 60% 59% Europe and Asia 54% 51% AMERICAN AIRLINES ESG REPORT 2021 61 \\ Customers \\ Team Members \\ Climate Change \\ Safety \\ ESG Strategy CEO Message INDEXES & DATA \\ Indexes & Data
 American Airlines ESG Report Page 61 Page 63