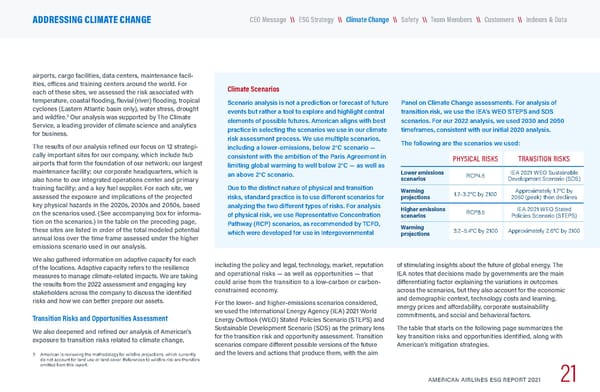
airports, cargo facilities, data centers, maintenance facil - ities, offices and training centers around the world. For each of these sites, we assessed the risk associated with temperature, coastal flooding, fluvial (river) flooding, tropical cyclones (Eastern Atlantic basin only), water stress, drought and wildfire. 3 Our analysis was supported by The Climate Service, a leading provider of climate science and analytics for business. The results of our analysis refined our focus on 12 strategi - cally important sites for our company, which include hub airports that form the foundation of our network; our largest maintenance facility; our corporate headquarters, which is also home to our integrated operations center and primary training facility; and a key fuel supplier. For each site, we assessed the exposure and implications of the projected key physical hazards in the 2020s, 2030s and 2050s, based on the scenarios used. (See accompanying box for informa - tion on the scenarios.) In the table on the preceding page, these sites are listed in order of the total modeled potential annual loss over the time frame assessed under the higher emissions scenario used in our analysis. We also gathered information on adaptive capacity for each of the locations. Adaptive capacity refers to the resilience measures to manage climate-related impacts. We are taking the results from the 2022 assessment and engaging key stakeholders across the company to discuss the identified risks and how we can better prepare our assets. Transition Risks and Opportunities Assessment We also deepened and refined our analysis of American’s exposure to transition risks related to climate change, 3 American is reviewing the methodology for wildfire projections, which currently do not account for land use or land cover. References to wildfire risk are therefore omitted from this report. Climate Scenarios Scenario analysis is not a prediction or forecast of future events but rather a tool to explore and highlight central elements of possible futures. American aligns with best practice in selecting the scenarios we use in our climate risk assessment process. We use multiple scenarios, including a lower-emissions, below 2°C scenario — consistent with the ambition of the Paris Agreement in limiting global warming to well below 2°C — as well as an above 2°C scenario. Due to the distinct nature of physical and transition risks, standard practice is to use different scenarios for analyzing the two different types of risks. For analysis of physical risk, we use Representative Concentration Pathway (RCP) scenarios, as recommended by TCFD, which were developed for use in Intergovernmental Panel on Climate Change assessments. For analysis of transition risk, we use the IEA’s WEO STEPS and SDS scenarios. For our 2022 analysis, we used 2030 and 2050 timeframes, consistent with our initial 2020 analysis. The following are the scenarios we used: PHYSICAL RISKS TRANSITION RISKS Lower emissions scenarios RCP4.5 IEA 2021 WEO Sustainable Development Scenario (SDS) Warming projections 1.7–3.2°C by 2100 Approximately 1.7°C by 2050 (peak) then declines Higher emissions scenarios RCP8.5 IEA 2021 WEO Stated Policies Scenario (STEPS) Warming projections 3.2–5.4°C by 2100 Approximately 2.6°C by 2100 including the policy and legal, technology, market, reputation and operational risks — as well as opportunities — that could arise from the transition to a low-carbon or carbon- constrained economy. For the lower- and higher-emissions scenarios considered, we used the International Energy Agency (IEA) 2021 World Energy Outlook (WEO) Stated Policies Scenario (STEPS) and Sustainable Development Scenario (SDS) as the primary lens for the transition risk and opportunity assessment. Transition scenarios compare different possible versions of the future and the levers and actions that produce them, with the aim of stimulating insights about the future of global energy. The IEA notes that decisions made by governments are the main differentiating factor explaining the variations in outcomes across the scenarios, but they also account for the economic and demographic context, technology costs and learning, energy prices and affordability, corporate sustainability commitments, and social and behavioral factors. The table that starts on the following page summarizes the key transition risks and opportunities identified, along with American’s mitigation strategies. AMERICAN AIRLINES ESG REPORT ff ff 21 \\ Indexes & Data \\ Customers \\ Team Members \\ Safety \\ ESG Strategy CEO Message ADDRESSING CLIMATE CHANGE \\ Climate Change
 American Airlines ESG Report Page 21 Page 23