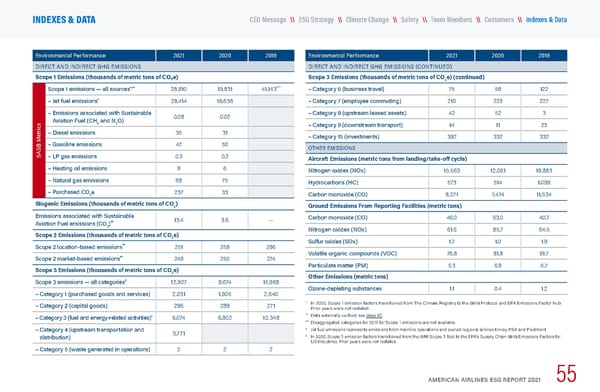
Environmental Performance 2021 2020 2019 DIRECT AND INDIRECT GHG EMISSIONS Scope 1 Emissions (thousands of metric tons of CO2e) SASB Metrics Scope 1 emissions — all sources *,** 28,810 19,831 41,143 *** – Jet fuel emissions † 28,414 19,636 – Emissions associated with Sustainable Aviation Fuel (CH 4 and N 2 O) 0.08 0.02 – Diesel emissions 35 31 – Gasoline emissions 47 50 – LP gas emissions 0.3 0.2 – Heating oil emissions 9 6 – Natural gas emissions 68 75 – Purchased CO 2 e 237 33 Biogenic Emissions (thousands of metric tons of CO 2 ) Emissions associated with Sustainable Aviation Fuel emissions (CO 2 ) ** 13.4 3.6 — Scope 2 Emissions (thousands of metric tons of CO 2 e) Scope 2 location-based emissions ** 251 258 296 Scope 2 market-based emissions ** 249 250 274 Scope 3 Emissions (thousands of metric tons of CO 2 e) Scope 3 emissions — all categories ‡ 12,907 9,674 15,968 – Category 1 (purchased goods and services) 2,031 1,905 2,640 – Category 2 (capital goods) 296 289 271 – Category 3 (fuel and energy-related activities) † 6,074 6,802 12,348 – Category 4 (upstream transportation and distribution) 3,771 – Category 5 (waste generated in operations) 2 2 2 Environmental Performance 2021 2020 2019 DIRECT AND INDIRECT GHG EMISSIONS (CONTINUED) Scope 3 Emissions (thousands of metric tons of CO 2 e) (continued) – Category 6 (business travel) 75 58 122 – Category 7 (employee commuting) 210 223 227 – Category 8 (upstream leased assets) 42 52 3 – Category 9 (downstream transport) 14 11 23 – Category 15 (investments) 392 332 332 OTHER EMISSIONS Aircraft Emissions (metric tons from landing/take-off cycle) Nitrogen oxides (NOx) 15,563 12,061 19,883 Hydrocarbons (HC) 573 514 1,099 Carbon monoxide (CO) 8,271 7,474 11,534 Ground Emissions From Reporting Facilities (metric tons) Carbon monoxide (CO) 46.0 63.0 40.7 Nitrogen oxides (NOx) 61.6 85.7 64.5 Sulfur oxides (SOx) 1.7 1.0 1.9 Volatile organic compounds (VOC) 76.8 81.8 91.7 Particulate matter (PM) 5.3 6.8 6.7 Other Emissions (metric tons) Ozone-depleting substances 1.1 0.4 1.2 * In 2020, Scope 1 emission factors transitioned from The Climate Registry to the GHG Protocol and EPA Emissions Factor Hub. Prior years were not restated. ** Data externally verified; see page 62 . *** Disaggregated categories for 2019 for Scope 1 emissions are not available. † Jet fuel emissions represents emissions from mainline operations and owned regional airlines Envoy, PSA and Piedmont. ‡ In 2020, Scope 3 emission factors transitioned from the WRI Scope 3 Tool to the EPA’s Supply Chain GHG Emissions Factors for US Industries. Prior years were not restated. AMERICAN AIRLINES ESG REPORT 2021 55 \\ Customers \\ Team Members \\ Climate Change \\ Safety \\ ESG Strategy CEO Message INDEXES & DATA \\ Indexes & Data
 American Airlines ESG Report Page 55 Page 57