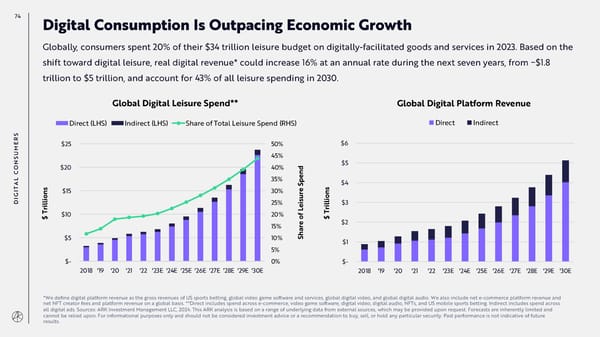
74 Digital Consumption Is Outpacing Economic Growth Globally, consumers spent 20% of their $34 trillion leisure budget on digitally-facilitated goods and services in 2023. Based on the shift toward digital leisure, real digital revenue* could increase 16% at an annual rate during the next seven years, from ~$1.8 trillion to $5 trillion, and account for 43% of all leisure spending in 2030. Global Digital Leisure Spend** Global Digital Platform Revenue Direct (LHS) Indirect (LHS) Share of Total Leisure Spend (RHS) Direct Indirect S R E $25 50% $6 M U 45% S N $5 CO $20 40% nd e L 35% p $4 A S T I $15 30% e ns G ns r io u io DI l 25% is l $3 il e il r L r T T $10 20% f $ o $ $2 15% e har $5 10% S $1 5% $- 0% $- 2018 '19 '20 '21 '22 '23E '24E '25E '26E '27E '28E '29E '30E 2018 '19 '20 '21 '22 '23E '24E '25E '26E '27E '28E '29E '30E *We define digital platform revenue as the gross revenues of US sports betting, global video game software and services, global digital video, and global digital audio. We also include net e-commerce platform revenue and net NFT creator fees and platform revenue on a global basis. **Direct includes spend across e-commerce, video game software, digital video, digital audio, NFTs, and US mobile sports betting. Indirect includes spend across all digital ads. Sources: ARK Investment Management LLC, 2024. This ARK analysis is based on a range of underlying data from external sources, which may be provided upon request. Forecasts are inherently limited and cannot be relied upon. For informational purposes only and should not be considered investment advice or a recommendation to buy, sell, or hold any particular security. Past performance is not indicative of future results.
 Annual Research Report | Big Ideas 2024 Page 73 Page 75