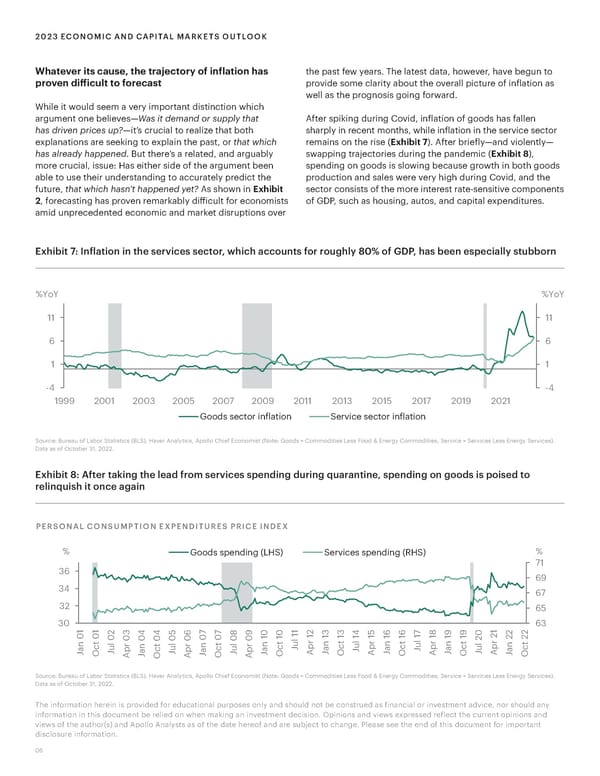
2023 ECONOMIC AND CAPITAL MARKETS OUTLOOK Whatever its cause, the trajectory of inflation has the past few years. The latest data, however, have begun to proven difficult to forecast provide some clarity about the overall picture of inflation as well as the prognosis going forward. While it would seem a very important distinction which argument one believes—Was it demand or supply that After spiking during Covid, inflation of goods has fallen has driven prices up?—it’s crucial to realize that both sharply in recent months, while inflation in the service sector explanations are seeking to explain the past, or that which remains on the rise (Exhibit 7). After briefly—and violently— has already happened. But there’s a related, and arguably swapping trajectories during the pandemic (Exhibit 8), more crucial, issue: Has either side of the argument been spending on goods is slowing because growth in both goods able to use their understanding to accurately predict the production and sales were very high during Covid, and the future, that which hasn’t happened yet? As shown in Exhibit sector consists of the more interest rate-sensitive components 2, forecasting has proven remarkably difficult for economists of GDP, such as housing, autos, and capital expenditures. amid unprecedented economic and market disruptions over Exhibit 7: Inflation in the services sector, which accounts for roughly 80% of GDP, has been especially stubborn %Yo %YoY Y 11 11 6 6 1 1 -4 -4 1999 2001 2003 2005 2007 2009 2011 2013 2015 2017 2019 2021 Goods sector inflation Service sector inflation Source: Bureau of Labor Statistics (BLS), Haver Analytics, Apollo Chief Economist (Note: Goods = Commodities Less Food & Energy Commodities; Service = Services Less Energy Services). Data as of October 31, 2022. Exhibit 8: After taking the lead from services spending during quarantine, spending on goods is poised to relinquish it once again PERSONAL CONSUMPTION EXPENDITURES PRICE INDEX % Goods spending ( erices spending ( % 36 71 69 34 67 32 65 30 1 1 2 5 7 7 1 2 5 7 1 2 2 63 3 4 4 6 8 9 0 0 1 1 3 3 4 1 6 6 1 8 9 9 0 2 0 0 0 0 0 1 1 1 1 1 1 1 1 1 1 2 2 2 0 0 0 0 0 0 0 l l t l t r t l r t r t l r t n c r n t l r n t l r n c u p n c u p n c u p n c p n c a u p a c u p a c u p a J a J a J a u a J O J A J O J A J O J A J O A J O A J O A J O J A J O Source: Bureau of Labor Statistics (BLS), Haver Analytics, Apollo Chief Economist (Note: Goods = Commodities Less Food & Energy Commodities; Service = Services Less Energy Services). Data as of October 31, 2022. The information herein is provided for educational purposes only and should not be construed as financial or investment advice, nor should any information in this document be relied on when making an investment decision. Opinions and views expressed reflect the current opinions and views of the author(s) and Apollo Analysts as of the date hereof and are subject to change. Please see the end of this document for important disclosure information. 06
 Apollo 2023 Economic and Capital Markets Outlook Page 5 Page 7