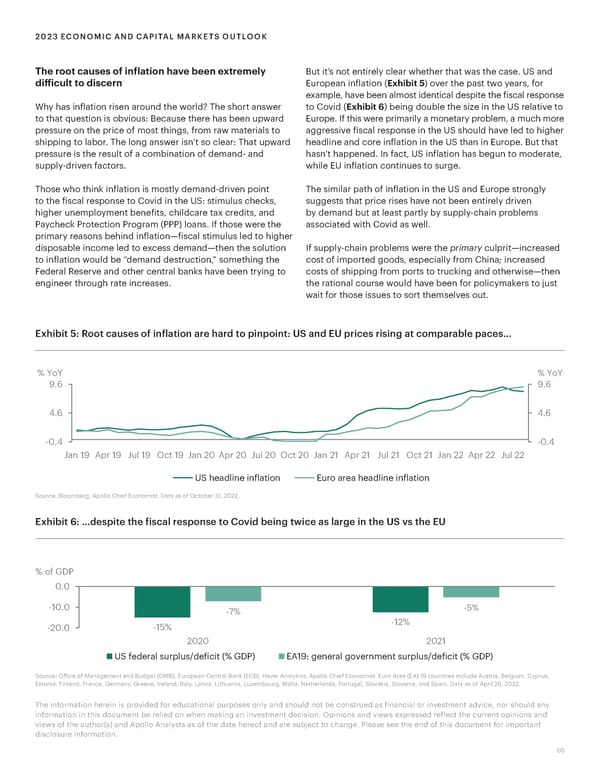
2023 ECONOMIC AND CAPITAL MARKETS OUTLOOK The root causes of inflation have been extremely But it’s not entirely clear whether that was the case. US and difficult to discern European inflation (Exhibit 5) over the past two years, for example, have been almost identical despite the fiscal response Why has inflation risen around the world? The short answer to Covid (Exhibit 6) being double the size in the US relative to to that question is obvious: Because there has been upward Europe. If this were primarily a monetary problem, a much more pressure on the price of most things, from raw materials to aggressive fiscal response in the US should have led to higher shipping to labor. The long answer isn’t so clear: That upward headline and core inflation in the US than in Europe. But that pressure is the result of a combination of demand- and hasn’t happened. In fact, US inflation has begun to moderate, supply-driven factors. while EU inflation continues to surge. Those who think inflation is mostly demand-driven point The similar path of inflation in the US and Europe strongly to the fiscal response to Covid in the US: stimulus checks, suggests that price rises have not been entirely driven higher unemployment benefits, childcare tax credits, and by demand but at least partly by supply-chain problems Paycheck Protection Program (PPP) loans. If those were the associated with Covid as well. primary reasons behind inflation—fiscal stimulus led to higher disposable income led to excess demand—then the solution If supply-chain problems were the primary culprit—increased to inflation would be “demand destruction,” something the cost of imported goods, especially from China; increased Federal Reserve and other central banks have been trying to costs of shipping from ports to trucking and otherwise—then engineer through rate increases. the rational course would have been for policymakers to just wait for those issues to sort themselves out. Exhibit 5: Root causes of inflation are hard to pinpoint: US and EU prices rising at comparable paces… % YoY % YoY 9.6 9.6 4.6 4.6 -0.4 -0.4 Jan 19 Apr 19 Jul 19 Oct 19 Jan 20 Apr 20 Jul 20 Oct 20 Jan 21 Apr 21 Jul 21 Oct 21 Jan 22 Apr 22 Jul 22 US headline inflation Euro area headline inflation Source: Bloomberg, Apollo Chief Economist. Data as of October 31, 2022. Exhibit 6: …despite the fiscal response to Covid being twice as large in the US vs the EU % of GDP 0.0 -10.0 - % -% -20.0 -1% -12% 2020 2021 US federal surplus/deficit (% GDP) EA19 eeral oeret surplus/deficit (% GDP) Source: Office of Management and Budget (OMB), European Central Bank (ECB), Haver Analytics, Apollo Chief Economist. Euro Area (EA) 19 countries include Austria, Belgium, Cyprus, Estonia, Finland, France, Germany, Greece, Ireland, Italy, Latvia, Lithuania, Luxembourg, Malta, Netherlands, Portugal, Slovakia, Slovenia, and Spain. Data as of April 26, 2022. The information herein is provided for educational purposes only and should not be construed as financial or investment advice, nor should any information in this document be relied on when making an investment decision. Opinions and views expressed reflect the current opinions and views of the author(s) and Apollo Analysts as of the date hereof and are subject to change. Please see the end of this document for important disclosure information. 05
 Apollo 2023 Economic and Capital Markets Outlook Page 4 Page 6