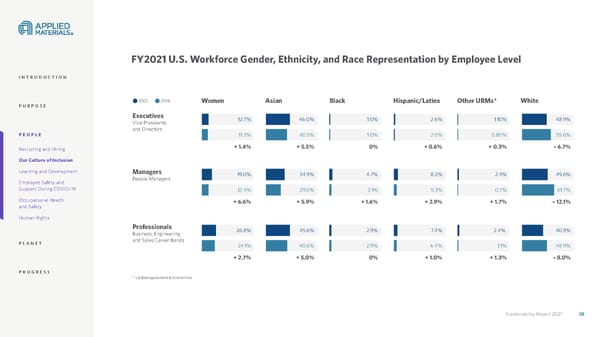
Sustainability Report 2021 38 FY2021 U.S. Workforce Gender, Ethnicity, and Race Representation by Employee Level Executives Vice Presidents and Directors Managers People Managers Professionals Business, Engineering and Sales Career Bands Women Asian Black Hispanic/Latinx Other URMs* White 12.7% 46.0% 1.0% 2.6% 1.10% 48.9% 40.5% 11.3% 1.0% 2.0% 0.80% 55.6% + 1.4% + 5.5% 0% – 6.7% + 0.6% + 0.3% 49.6% 19.0% 34.9% 4.7% 8.2% 2.4% 12.4% 61.7% 29.0% 3.1% 5.3% 0.7% – 12.1% + 6.6% + 5.9% + 1.7% + 1.6% + 2.9% 2.4% 40.9% 26.8% 45.6% 2.9% 7.4% 48.9% 1.1% 24.1% 40.6% 2.9% 6.4% + 1.3% – 8.0% + 2.7% + 1.0% + 5.0% 0% 2021 2016 INTRODUCTION PURPOSE PEOPLE Recruiting and Hiring Our Culture of Inclusion Learning and Development Employee Safety and Support During COVID-19 Occupational Health and Safety Human Rights PLANET PROGRESS * Underrepresented minorities
 Applied Materials Sustainability Report Page 37 Page 39