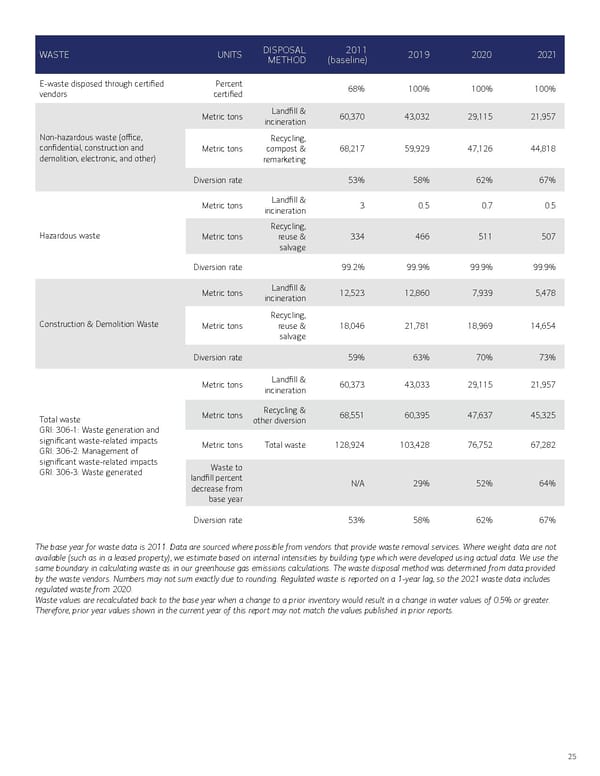
WASTE UNITS DISPOSAL METHOD 2011 (baseline) 2019 2020 2021 E-waste disposed through certified vendors Percent certified 68% 100% 100% 100% Non-hazardous waste (office, confidential, construction and demolition, electronic, and other) Metric tons Landfill & incineration 60,370 43,032 29,115 21,957 Metric tons Recycling, compost & remarketing 68,217 59,929 47,126 44,818 Diversion rate 53% 58% 62% 67% Hazardous waste Metric tons Landfill & incineration 3 0.5 0.7 0.5 Metric tons Recycling, reuse & salvage 334 466 511 507 Diversion rate 99.2% 99.9% 99.9% 99.9% Construction & Demolition Waste Metric tons Landfill & incineration 12,523 12,860 7,939 5,478 Metric tons Recycling, reuse & salvage 18,046 21,781 18,969 14,654 Diversion rate 59% 63% 70% 73% Total waste GRI : 306-1: Waste generation and significant waste-related impacts GRI : 306-2: Management of significant waste-related impacts GRI : 306-3: Waste generated Metric tons Landfill & incineration 60,373 43,033 29,115 21,957 Metric tons Recycling & other diversion 68,551 60,395 47,637 45,325 Metric tons Total waste 128,924 103,428 76,752 67,282 Waste to landfill percent decrease from base year 2 N/A 29% 52% 64% Diversion rate 5 53% 58% 62% 67% The base year for waste data is 2011. Data are sourced where possible from vendors that provide waste removal services. Where weight data are not available (such as in a leased property), we estimate based on internal intensities by building type which were developed using actual data. We use the same boundary in calculating waste as in our greenhouse gas emissions calculations. The waste disposal method was determined from data provided by the waste vendors. Numbers may not sum exactly due to rounding. Regulated waste is reported on a 1-year lag, so the 2021 waste data includes regulated waste from 2020. Waste values are recalculated back to the base year when a change to a prior inventory would result in a change in water values of 0.5% or greater. Therefore, prior year values shown in the current year of this report may not match the values published in prior reports.
 Bank of America ESG Report Page 24 Page 26