Bank of America ESG Report
BANK OF AMERICA CORPORATION 2021 Environmental, Social & Governance Performance Data Summary and Global Reporting Initiative Index
Contents Measuring Against Our Environmental, Social and Governance Goals 3 People 3 Training 3 Employee Benefits and Health 3 Planet Goals and Performance 6 Principles of Governance 7 Prosperity 10 Economic Opportunity for Communities of Color 10 Enabling Financial Health 13 Planet, People and Prosperity: Sustainable Finance 14 Planet 15 Greenhouse Gas Emissions 17 Paper, Water, Waste, and Other Environmental Data 23 GRI Content Index 28

This is a modal window.
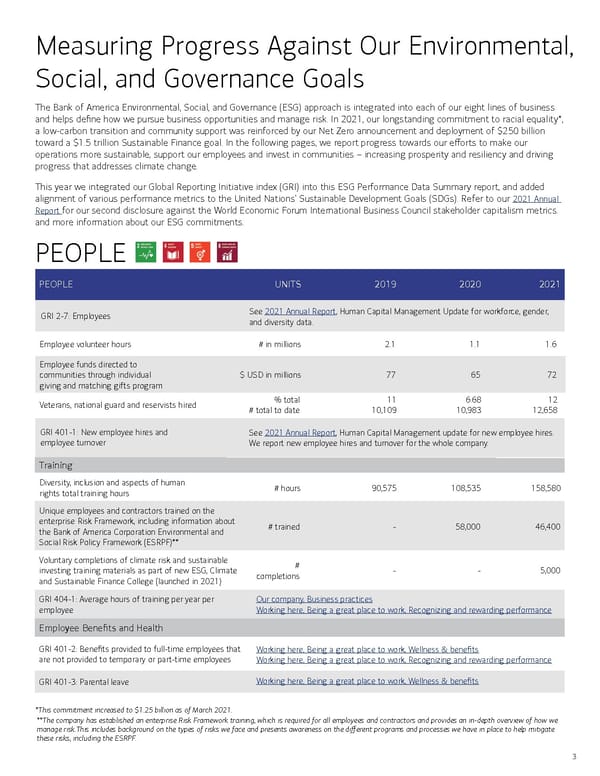
3 Measuring Progress Against Our Environmental, Social, and Governance Goals The Bank of America Environmental, Social, and Governance (ESG) approach is integrated into each of our eight lines of business and helps define how we pursue business opportunities and manage risk. In 2021, our longstanding commitment to racial equality *, a low-carbon transition and community support was reinforced by our Net Zero announcement and deployment of $250 billion toward a $1.5 trillion Sustainable Finance goal. In the following pages, we report progress towards our efforts to make our operations more sustainable, support our employees and invest in communities – increasing prosperity and resiliency and driving progress that addresses climate change. This year we integrated our Global Reporting Initiative index (GRI) into this ESG Performance Data Summary report, and added alignment of various performance metrics to the United Nations’ Sustainable Development Goals (SDGs). Refer to our 2021 Annual Report for our second disclosure against the World Economic Forum International Business Council stakeholder capitalism metrics. and more information about our ESG commitments. PEOPLE PEOPLE UNITS 2019 2020 2021 GRI 2-7: Employees See 2021 Annual Report , Human Capital Management Update for workforce, gender, and diversity data. Employee volunteer hours # in millions 2.1 1.1 1.6 Employee funds directed to communities through individual giving and matching gifts program $ USD in millions 77 65 72 Veterans, national guard and reservists hired % total 11 6.68 12 # total to date 10,109 10,983 12,658 GRI 401-1: New employee hires and employee turnover See 2021 Annual Report , Human Capital Management update for new employee hires. We report new employee hires and turnover for the whole company. Training Diversity, inclusion and aspects of human rights total training hours # hours 90,575 108,535 158,580 Unique employees and contractors trained on the enterprise Risk Framework, including information about the Bank of America Corporation Environmental and Social Risk Policy Framework (ESRPF)** # trained - 58,000 46,400 Voluntary completions of climate risk and sustainable investing training materials as part of new ESG, Climate and Sustainable Finance College (launched in 2021) # completions - - 5,000 GRI 404-1: Average hours of training per year per employee Our company, Business practices Working here, Being a great place to work, Recognizing and rewarding performance Employee Benefits and Health GRI 401-2: Benefits provided to full-time employees that are not provided to temporary or part-time employees Working here, Being a great place to work, Wellness & benefits Working here, Being a great place to work, Recognizing and rewarding performance GRI 401-3: Parental leave Working here, Being a great place to work, Wellness & benefits *This commitment increased to $1.25 billion as of March 2021. **The company has established an enterprise Risk Framework training, which is required for all employees and contractors and provides an in-depth overview of how we manage risk.This includes background on the types of risks we face and presents awareness on the diff erent programs and processes we have in place to help mitigate these risks, including the ESRPF.
4 GRI 403-1: Occupational health and safety management system See the Human Capital Management content in the 2021 Annual Report (pages 38- 41) for information on how Bank of America supports employee safety and health throughout the pandemic, and for examples of safety processes implemented based on CDC guidance. In addition, Bank of America’s Enterprise Occupational Safety & Health Policy complies with relevant statutory requirements relating to health, safety and the physical environment, as they affect employees, suppliers, clients and the public. Bank of America Corporation is committed to providing a safe working environment for its employees, customers, third party suppliers and any others operating within Company premises or at the behest of the Company. a. Bank of America maintains a global safety program that aligns with applicable laws, rules and regulations and is supplemented by regional safety and health systems that support the Bank’s policy. b. The Bank’s Safety Program covers all employees, workplaces, and activities conducted on behalf of the Bank. The Bank’s Safety Program incorporates the following statement: Safety is everyone’s responsibility. Supporting workplace safety assures your own protection and the protection of other employees, customers, contractors/suppliers and the general public. GRI 403-2: Hazard identification, risk assessment, and incident investigation The Bank’s Occupational Safety & Health Council advises on direction and changes of the Enterprise Occupational Safety & Health Policy. It reviews the safety and health metric dashboard and corresponding action plans quarterly in line with Policy objectives and resolves issues and risks that have been escalated. a. Objective of the Bank of America Safety Program is to provide a safe work environment and to identify, correct and eliminate workplace hazards. Employees may raise issues regarding workplace health or safety to the 24/7 security hotline. Additionally, workplace hazards should be reported to an appropriate member of management, the site safety coordinator (if applicable), Corporate Workplace (Facility Management) or anonymously through the Ethics and Compliance Hotline. b. Bank of America’s Employee Handbook states the following: “All employees have the right to raise issues or file a workplace health or safety complaint without fear of retaliation. To anonymously report any complaints, contact the Ethics and Compliance Hotline...” Additionally, there are numerous Whistleblower Policies in place across the globe. GRI 403-3: Occupational health services See the 2021 Annual Report (pages 38-41) for information on how Bank of America supports employee safety and health throughout the pandemic. In addition, the Bank ensures the availability of health services for all employees who require consultations and/or care related to a workplace hazard or incident, including dedicated Life Events Services or Employee Assistance Program resources as needed to facilitate a smooth transition back to work. Our Life Safety team facilitates the Occupational Safety & Health Council at an enterprise level, ensuring multiples lines of business work together to identify and minimize risk across their functions and our global footprint. Regionally-based security/safety managers proactively assess and mitigate many situational and physical risks while also responding to workplace safety concerns escalated through our numerous reporting channels (24/7 Security Hotline, See Something Say Something anonymous reporting, direct engagement, etc.). The Bank has further prioritized the safety and health of our employees in direct response to the coronavirus. GRI 403-4: Worker participation, consultation, and communication on occupational health and safety The Bank engages in a variety of consultation and communication activities dependent upon sizes of offices ranging from direct senior management face to face meetings through to health and safety committees and works councils at which employee representatives are attendees. The Bank’s Occupational Safety & Health Council advises on direction and changes of the Enterprise Occupational Safety & Health Policy. It reviews the safety and health metric dashboard and corresponding action plans quarterly in line with Policy objectives and resolves issues and risks that have been escalated to the Council. See also the Bank of America Annual Report (page 38-41). PEOPLE
5 GRI 403-5: Worker training on occupational health and safety Annual safety related enterprise training is required of all employees and is compliant with applicable laws, rules and regulations. Additionally, safety and health training is provided for specific work environment hazards/risks in accordance with laws, rules and regulations (i.e., Chemical Inventory and Material Safety Data Sheets and Powered Industrial Truck Operator Training Assessment and Asset Inventory). See also the Bank of America Annual Report (pages 38-41, 120) for information on well-being-related trainings and other expanded resources. GRI 403-6: Promotion of worker health Throughout 2021, we supported our employees as they adapted to the developing global health crisis. We expanded our health and wellness programs, increased benefits for child and adult care, provided flexible time off and offered free COVID-19 testing as well as vaccine clinics in some of our workspaces. Please refer to our Annual Report (pages 38-41) for additional worker health programs. GRI 403-7: Prevention and mitigation of occupational health and safety impacts directly linked by business relationships Where the Bank does not own the building, we manage safety and health risk through contractual agreements, and relationships with landlords and third party suppliers to identify and resolve unfavorable safety and health conditions in the workplace. Suppliers are bound by contract to adhere to Bank policies and standards while performing services for or on behalf of Bank of America and/or when on Bank premises. Customers, employees and visitors are required to adhere to all posted safety signage, including, but not limited to mask use and social distancing (compliance with which is monitored daily), no smoking, firearms prohibitions, etc. Also refer to our Annual Report (pages 38-41) for additional COVID response information. GRI 403-8: Workers covered by an occupational health and safety management system As mentioned previously, all employees are covered under the Bank’s Enterprise Safety Program. The Bank has 212,505 employees and 53,414 non-employees for an Enterprise total of 265,919. Note non-employee number includes contractors, consultants, outsourced/access only and joint venture. Bank of America’s Safety Program is subject to the Bank’s internal Audit process as well as Federal OSHA and state and local safety and health agency inspections. GRI 404-2: Programs for upgrading employee skills and transition assistance programs Working here, Being a great place to work, Wellness & benefits Working here, Being a great place to work, Recognizing and rewarding performance GRI 404-3: Percentage of employees receiving regular performance and career development reviews Working here, Being a great place to work, Wellness & benefits Omission - Part of Disclosure Omitted: Percentage of employees receiving regular performance and career development reviews Reason for Omission: Not applicable. The percentage of completed reviews does not necessarily speak to our overall pay-for-performance methodology, and this detail has not been included in the past for ESG purposes. GRI 405-1: Diversity of governance bodies and employees Working here, Being a great place to work, Diversity & inclusion GRI 405-2: Ratio of basic salary and remuneration of women to men 2022 Proxy Statement , 2021 Annual Report
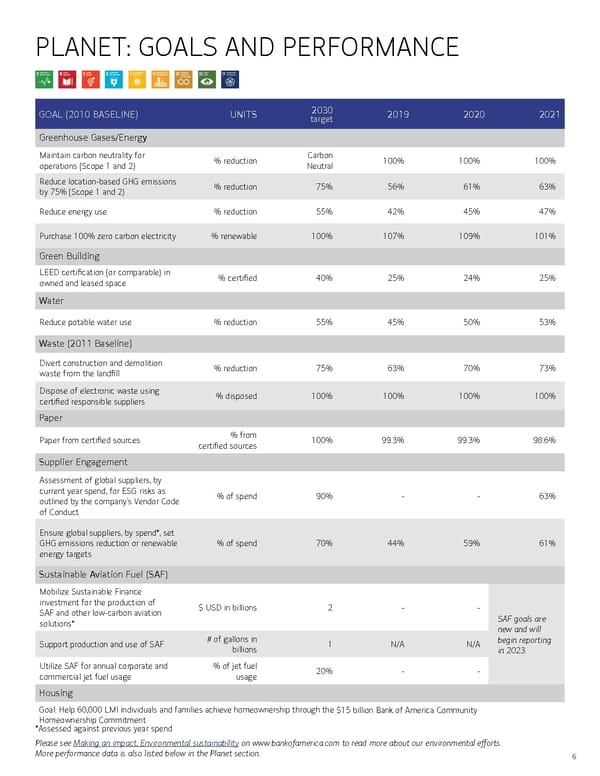
6 PLANET: GOALS AND PERFORMANCE GOAL (2010 BASELINE) UNITS 2030 target 2019 2020 2021 Greenhouse Gases/Energy Maintain carbon neutrality for operations (Scope 1 and 2) % reduction Carbon Neutral 100% 100% 100% Reduce location-based GHG emissions by 75% (Scope 1 and 2) % reduction 75% 56% 61% 63% Reduce energy use % reduction 55% 42% 45% 47% Purchase 100% zero carbon electricity % renewable 100% 107% 109% 101% Green Building LEED certification (or comparable) in owned and leased space % certified 40% 25% 24% 25% Water Reduce potable water use % reduction 55% 45% 50% 53% Waste (2011 Baseline) Divert construction and demolition waste from the landfill % reduction 75% 63% 70% 73% Dispose of electronic waste using certified responsible suppliers % disposed 100% 100% 100% 100% Paper Paper from certified sources % from certified sources 100% 99.3% 99.3% 98.6% Supplier Engagement Assessment of global suppliers, by current year spend, for ESG risks as outlined by the company’s Vendor Code of Conduct % of spend 90% - - 63% Ensure global suppliers, by spend*, set GHG emissions reduction or renewable energy targets % of spend 70% 44% 59% 61% Sustainable Aviation Fuel (SAF) Mobilize Sustainable Finance investment for the production of SAF and other low-carbon aviation solutions* $ USD in billions 2 - - SAF goals are new and will begin reporting in 2023. Support production and use of SAF # of gallons in billions 1 N/A N/A Utilize SAF for annual corporate and commercial jet fuel usage % of jet fuel usage 20% - - Housing Goal: Help 60,000 LMI individuals and families achieve homeownership through the $15 billion Bank of America Community Homeownership Commitment *Assessed against previous year spend Please see Making an impact, Environmental sustainability on www.bankofamerica.com to read more about our environmental efforts. More performance data is also listed below in the Planet section.
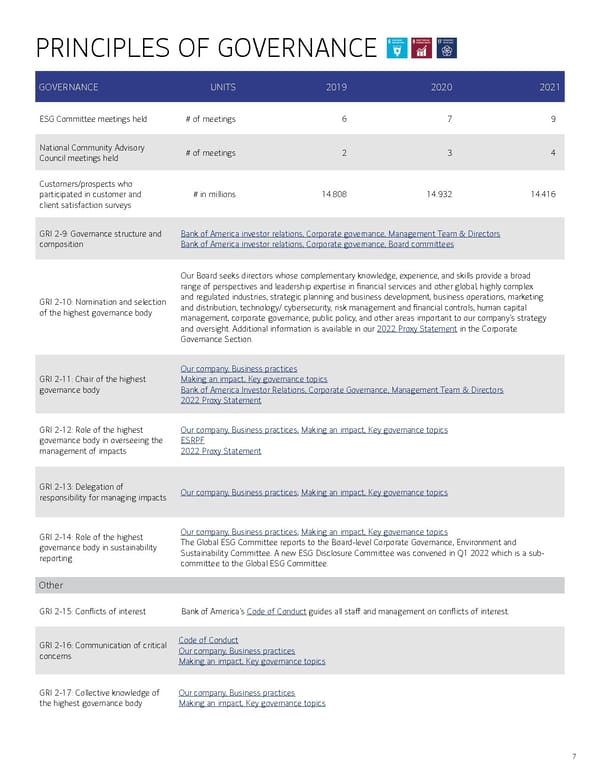
7 PRINCIPLES OF GOVERNANCE GOVERNANCE UNITS 2019 2020 2021 ESG Committee meetings held # of meetings 6 7 9 National Community Advisory Council meetings held # of meetings 2 3 4 Customers/prospects who participated in customer and client satisfaction surveys # in millions 14.808 14.932 14.416 GRI 2-9: Governance structure and composition Bank of America investor relations, Corporate governance, Management Team & Directors Bank of America investor relations, Corporate governance, Board committees GRI 2-10: Nomination and selection of the highest governance body Our Board seeks directors whose complementary knowledge, experience, and skills provide a broad range of perspectives and leadership expertise in financial services and other global, highly complex and regulated industries, strategic planning and business development, business operations, marketing and distribution, technology/ cybersecurity, risk management and financial controls, human capital management, corporate governance, public policy, and other areas important to our company’s strategy and oversight. Additional information is available in our 2022 Proxy Statement in the Corporate Governance Section. GRI 2-11: Chair of the highest governance body Our company, Business practices Making an impact, Key governance topics Bank of America Investor Relations, Corporate Governance, Management Team & Directors 2022 Proxy Statement GRI 2-12: Role of the highest governance body in overseeing the management of impacts Our company, Business practices; Making an impact, Key governance topics ESRPF 2022 Proxy Statement GRI 2-13: Delegation of responsibility for managing impacts Our company, Business practices ; Making an impact, Key governance topics GRI 2-14: Role of the highest governance body in sustainability reporting Our company, Business practices ; Making an impact, Key governance topics The Global ESG Committee reports to the Board-level Corporate Governance, Environment and Sustainability Committee. A new ESG Disclosure Committee was convened in Q1 2022 which is a sub- committee to the Global ESG Committee. Other GRI 2-15: Conflicts of interest Bank of America’s Code of Conduct guides all staff and management on conflicts of interest. GRI 2-16: Communication of critical concerns Code of Conduct Our company, Business practices Making an impact, Key governance topics GRI 2-17: Collective knowledge of the highest governance body Our company, Business practices Making an impact, Key governance topics
8 GRI 2-18: Evaluation of the performance of the highest governance body 2022 Proxy Statement GRI 2-19: Remuneration policies 2022 Proxy Statement , Compensation governance and risk management Working here, Being a great place to work, Recognizing and rewarding performance GRI 2-20: Process to determine remuneration 2022 Proxy Statement , Compensation governance and risk management Working here, Being a great place to work, Recognizing and rewarding performance GRI 2-21: Annual total compensation ratio 2022 Proxy Statement ; 2021 Annual Report GRI 2-22: Statement on sustainable development strategy 2021 Annual Report , A letter from Chairman and CEO Brian Moynihan GRI 2-23: Policy commitments Our company, Business practices, responsible growth ; Vendor Code of Conduct ; Code of Conduct We apply the precautionary approach to identifying and addressing longer-term environmental issues that may impact our business, clients and communities, including global climate change. Our commitment to specific policies, industry best practices and collaboration with external experts helps to inform our risk assessments in this area. GRI 2-24: Embedding policy commitments Our company, Business practices, responsible growth , Vendor Code of Conduct ; Code of Conduct GRI 2-25: Processes to remediate negative aspects We encourage our employees and vendor employees to speak up, without retaliation, about any concerns they may have, including through our grievance channels. Through our Ethics and Compliance hotline, our employees and our vendor employees can report complaints or possible violations regarding ethical issues or other inappropriate activity, including adverse impacts on human rights. For additional information, see our Code of Conduct . GRI 2-26: Mechanisms for seeking advice and raising concerns Code of Conduct ; Making an impact, Key governance topics GRI 2-27: Compliance with laws and regulations Our 2021 Environmental operations data, Environmental Spend GRI 2-28: Membership associations Bank of America investor relations, Political Activities Archive GRI 2-29: Approach to stakeholder engagement Our company, business practices Making an impact, Key governance topics 2021 Annual Report GRI 2-30: Collective bargaining agreements Direct response: No U.S.-based employees are subject to collective bargaining agreements. GRI 205-1: Operations assessed for risks Business units are routinely analyzed for risks related to corruption. GRI 205-2: Communication and training about anti-corruption policies and procedures Bank of America employees are regularly trained in anti-corruption policies as part of our Code of Conduct training.
9 GRI 415-1: Political contributions Bank of America investor relations, Political Activities Archive GRI 417-1: Requirements for product and service information and labeling Our company, What we offer, Enabling financial health GRI 417-2: Incidents of non- compliance concerning product and service information and labeling We report material non-compliance incidents according to SEC standards. GRI 417-3: Incidents of non- compliance concerning marketing communications We report material non-compliance incidents according to SEC standards. GRI 418-1: Substantiated complaints concerning breaches of customer privacy and losses of Our company, Business practices Making an impact, Key governance topics
10 PROSPERITY UNITS 2019 2020 2021 Women supported through ESG programs and partnerships (e.g. Cornell, Tory Burch Foundation, Cherie Blair, Kiva)* # of women 19,000+ 50,000+ 75,000+ Countries represented by those enrolled in the Bank of America Institute for Women’s Entrepreneurship at Cornell* # of countries 65+ 85 116 Philanthropic giving to support economic mobility $ USD in millions 250 350 370 Economic Opportunity for Communities of Color 2021 equity investments and philanthropic commitments toward our five-year, $1.25 billion racial equality and economic opportunity initiative: $450 USD in millions Organizations supported in communities of color** # organizations - - 896 Minority-focused equity funds supported** # funds - - 104 Minority Depository Institutions (MDIs) supported** # institutions supported - - 22 Workforce development and education grants $ USD in millions 59 68 94 Community development grants $ USD in millions 52 62 87 Basic needs grants # of women 46 125 81 Giving to support the arts $ USD in millions 36 50 52 Arts organizations supported # of organizations 2,300 1,850 1750 Art conservation projects funded*** # of projects 22 - 23 Countries with funded art conservation projects*** # of countries 9 - 13 GRI: 203-1: Infrastructure investments and services supported Our company, What we offer, Enabling financial health ; Small business ; Homeownership Affordable housing units financed by Community Development Banking # of units 8,200 13,000 11,600 *Cumulative values expressed within this report leverage historic methods to derive and / or estimate values. Methodologies and internal control frameworks regarding value reporting continue to evolve. **Tracking for these data points began in 2021 as it relates to the five-year, $1.25 billion commitment to racial equality and economic opportunity. ***No grants awarded in 2020 as funds were reallocated to support the critical operating needs for arts partners.
11 UNITS 2019 2020 2021 Total Community Development Financial Institutions (CDFIs) with loans, investments, deposits and/or capital grants as of year-end # of CDFIs 254 256 252 CDFI loans, investments, deposits and/or capital grants that closed during the year $ USD in millions 337 394 400 Total CDFI loans, investments, deposits and capital grants as of year-end $ USD in billions 1,700 1,800 2,200 Green, Social and Sustainability bonds issued – cumulative since 2013* $ USD in millions 6,850 9,850 11,900 # bonds 6 8 9 Tax Equity renewable energy portfolio size – cumulative since 2007* $ USD in millions 8,500 10,100 12,328 Renewable energy installed through tax equity investments – cumulative since 2007* # in Megawatts 24,916 33,163 37,940 GRI: 413-1: Operations with local community engagement, impact assessments, and development programs Our company, What we offer, Enabling financial health ; Small business ; Homeownership Branches located in LMI geographies % of branches 29.4% 29.5% 29.9% Community Development Banking Investments to help build strong, sustainable communities by financing affordable housing and economic development across the country – including lending, equity investments and debt commitments $ USD in millions 4,880 5,870 6,600 Value of first mortgages extended to U.S. homeowners $ USD in millions 72,478 69,053 79,684 Value of first mortgages to LMI customers $ USD in millions 7,956 9,829 10,731 Total first mortgage customers # of customers 135,900 135,598 141,098 % of customers 50.1 56.2 61.9 LMI first mortgage customers # of customers 30,999 38,662 39,193 % of customers 22.8 28.5 27.8 Value of home equity lines of credit extended to LMI customers $ USD in millions 1,987 1,403 734 Total credit to small business owners (new and renewal) $ USD in millions 38,900 50,300 34,800 New credit to small business owners $ USD in millions 9,185 5,058 9,333 *Cumulative values expressed within this report leverage historic methods to derive and / or estimate values. Methodologies and internal control frameworks regarding value reporting continue to evolve.
UNITS 2019 2020 2021 LMI loans extended to small businesses* $ USD in millions 7,668 14,650 11,836 # of loans 435,691 445,007 600,959 Small business loans that are LMI loans % of small business loans 71 65 77 Small business clients** # clients in millions - - 10,520 GRI 201-1: Direct economic value generated and distributed Financial Statements within 2021 Annual Report GRI 203-2: Significant indirect economic impacts Our company, What we offer, Enabling financial health, Small business Our company, What we offer, Enabling financial health, Homeownership Prosperity, Enabling financial health 2021 Annual Report GRI 201-2: Financial implications and other risks and opportunities due to climate change 2021 CDP Climate Change Report ; 2020 TCFD Report GRI 201-3: Defined benefit plan obligations and other retirement plans Working here, Being a great place to work, Wellness & benefits 2021 Annual Report , Note 17, Pension and Postretirement Plans GRI 201-4: Financial assistance received from government Bank of America did not benefit from any direct capital or liquidity assis tance from the U.S. government in 2021. GRI 407-1: Operations and suppliers in which the right to freedom of association and collective bargaining may be at risk With respect to our operations, no U.S.-based employees are subject to collective bargaining agreements. For our supply chain, we do not collect this data. GRI 412-1: Operations that have been subject to human rights reviews or impact assessments HR Statement , Vendor Code of Conduct and Modern Slavery Act Statement GRI 414-1: New suppliers that were screened using social criteria As part of our supply chain monitoring process, all suppliers receive our Vendor Code of Conduct , which sets forth our expectations for human rights, labor and environmental standards throughout our global supply chain. We monitor compliance with the code using a risk-based approach, which includes assessing our largest suppliers for ESG risk prior to contracting. Our contract templates include terms to ensure that our suppliers are obligated to comply with the expectations set forth in our code. 12 *PPP contributed to higher loan balance extensions in 2020. **Methodology used to determine this metric changed in 2021, so data prior to this period would not be comparable.
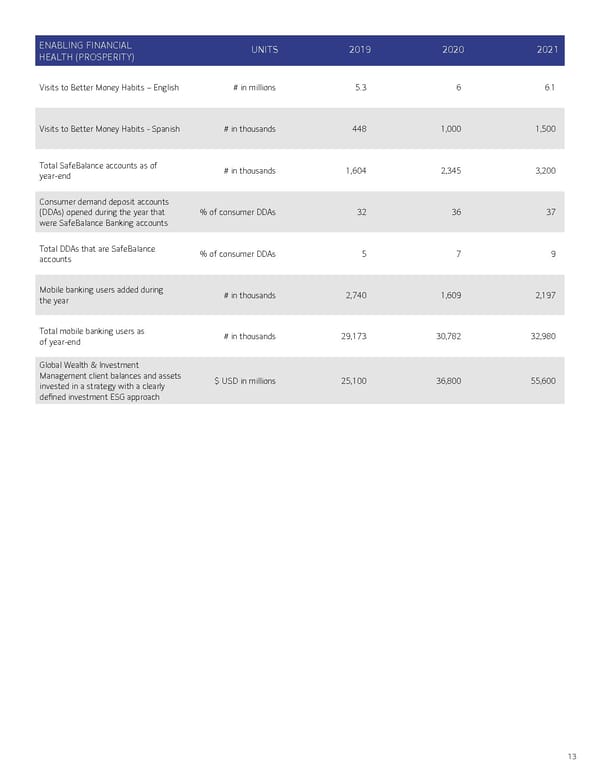
13 ENABLING FINANCIAL HEALTH (PROSPERITY) UNITS 2019 2020 2021 Visits to Better Money Habits – English # in millions 5.3 6 6.1 Visits to Better Money Habits - Spanish # in thousands 448 1,000 1,500 Total SafeBalance accounts as of year-end # in thousands 1,604 2,345 3,200 Consumer demand deposit accounts (DDAs) opened during the year that were SafeBalance Banking accounts % of consumer DDAs 32 36 37 Total DDAs that are SafeBalance accounts % of consumer DDAs 5 7 9 Mobile banking users added during the year # in thousands 2,740 1,609 2,197 Total mobile banking users as of year-end # in thousands 29,173 30,782 32,980 Global Wealth & Investment Management client balances and assets invested in a strategy with a clearly defined investment ESG approach $ USD in millions 25,100 36,800 55,600

This is a modal window.
14 Planet, people and prosperity: Sustainable finance At Bank of America, sustainability guides how we conduct our business and operations as well as how we pursue Responsible Growth across core lending and investments, equity and debt capital markets activities, advisory services, supply chain financing and management, daily operations and engagement with internal teammates. The Global Sustainable Finance Group works with our Management Team and partners across 8 lines of business to establish our firmwide sustainable finance strategy, sets firmwide capital deployment and mobilization goals (such as our $1.5 trillion sustainable finance commitment by 2030), drives thought leadership across international alliances and taskforces, helps expand existing sustainable finance activities across LOBs and innovates in new areas of decarbonization financing and investments (such as green project finance and catalytic blended finance structures for emerging markets). We focus on delivering a consistent framework on taxonomy, process and impact evaluation across the firm, and stay laser focused on enterprise goals of achieving net zero emissions before 2050 and ensure in all of our businesses and communities, we deliver for the 17 United Nations Sustainable Development Goals. The two main pillars of the Sustainable Finance business focus are: Environmental Transition Address climate change and promote the circular economy including solutions for renewable energy, energy efficiency, clean transportation, water & sanitation, recycling, sustainable agriculture, and carbon capture & sequestration Inclusive Social Development Advance community development, affordable housing, healthcare, education, financial inclusion, and gender/ racial equality Segmentation Environmental Transition ($ USD MM) Social Inclusive Development ($ USD MM) Total 2021 Activity ($ USD MM) - Global Corporate and Investment Bank: Advisory, lend ing, leasing and capital markets activity for clients and activity aligned with the SDGs 109,804 48,904 158,708 Global Markets: Capital markets advisory, underwriting and distribution f or municipal and corporate clients and activity aligned with the SDGs 28,727 19,328 48,055 Global Commercial Banking: Advisory, lending, leasing and capital markets activity for clients and activity aligned with the SDGs 1,997 9,725 11,722 Business Banking: Lending to clients aligned with the SDGs 12 238 250 Retail and Preferred: Hybrid/Electric Vehicle lending, LMI lending for homeownership and small business 1,127 7,395 8,522 Merrill and Private Bank: Increase in client assets with a clearly defined ESG investment approach 12,531 6,265 18,796 All Other 3,126 2,484 5,610 Total 157,324 94,339 251,663
15 PLANET ENVIRONMENTAL SUSTAINABILITY UNITS 2019 2020 2021 Environmentally-focused giving $ USD in millions 24 20.1 20.1 ENVIRONMENTAL AND SOCIAL RISK Indicator Response Year # of transactions subject to the Equator Principles 2 Category B transactions in the power generation sector (United States) 2016 2 Category B transactions in the oil & gas sector (United States) 2017 1 Category B transaction in the petrochemicals sector (United States) 2018 1 Category A transaction, 1 Category B transaction, both in the oil and gas sector (United States). 2019 1 Category B transaction in the oil & gas sector (Canada) 2020 2 Category B transactions: one in the oil & gas sector (Canada) and one in the power generation sector - wind (USA) 2021 Examples of transactions requiring additional review Examples of transactions requiring additional review: 1. Bank of America was invited to support advisory services and a capital markets oppor tunity for a commercial agricultural company in a developing part of the world. Bank of America consulted with an independent consultant on the various ESG risks faced by this firm, specific to their geography of operations and in their supply chain. As a condition of our involvement and the capital markets opportunity, the company committed to a number of improvements on transparency, managing supply chain traceability, and on better ways - to address human rights issues. 2. Bank of America was approached by a company with international operations in the chemicals sector to provide financial products and services to the firm. Bank of America ESG subject matter experts conducted an enhanced review of the firm’s ESG performance. The review included direct engagement with senior and executive staff from the firm on various aspects of their performance on environmental, social, and governance concerns. The bank’s ESG subject matter experts represented these risks to an internal Bank of America review committee to discuss the history of issues at this firm and their trajectory of improved performance. After this review, Bank of America decided to move forward on engagement with the firm. 3. Bank of America was asked by a company in the steel processing and mining sector to help underwrite an opportunity in the capital markets. Bank of America retained a consultant to conduct an independent review of the firm’s ESG performance. Using the independent review as a guideline, Bank of America subject matter experts engaged with senior and executive staff from the company to further evaluate the company’s public com mitments and goals on ESG issues. Bank of America moved forward with providing products and services to the firm and will continue to monitor the firm’s improvement - on ESG issues including climate change related goals and targets, improved community engagement and environmental risk management at mining operations. 2021
16 Environmental and Social Risk Policy Framework Reporting Environmental and Social Risk Policy Framework (ESRPF) related items, relationships and transactions discussed by the responsible risk committees in 2021. Region: APAC: 8 EMEA: 9 Global: 5 LatAm: 9 USA: 16 Area: Environmental: 11 Environmental and Social: 6 Social: 30 Sector: 30 6 11 Energy and Extractives: 9 Financial Services: 17 Gaming: 5 Other: 16 In 2021, we continued our process of tracking ESRP Framework related items, relationships and transactions reviewed by the responsible risk committees. Our front-line units have primary responsibility for evaluating and managing all risks, including the environmental and social risks inherent within their businesses. Through this process of due diligence, many issues are resolved and do not need to be escalated to risk review committee. The chart above represents only those items, relationships or transactions related to environmental or social risk that were discussed by the responsible risk committees. For more information about our governance structure or risk framework, see the Business Standards report or the ESRP Framework. 5 9 8 9 16 17 5 9 16
About Our 2021 Environmental Operations Data We continue to track and manage the environmental impacts of our operations and refine our methodology in order to most accurately collect and report on these data. Our 2021 environmental activities are reported here using the Global Reporting Initiative Standards, as well as its Financial Services Sector Disclosure. GREENHOUSE GAS EMISSIONS UNITS 2010 (baseline) 2019 2020 2021 Scope 1 and location-based Scope 2 emissions Scope 1 direct emissions Metric tons CO 2 e 106,870 62,639 53,390 57,076 Location-based Scope 2 indirect emissions Metric tons CO 2 e 1,678,547 722,188 650,553 601,906 Total Scope 1 and location-based Scope 2 emissions Metric tons CO 2 e 1,785,417 784,826 703,943 658,982 Reduction in total Scope 1 and location-based Scope 2 emissions Percent decrease from base year - 56% 61% 63% Scope 1 and market-based Scope 2 emissions Scope 1 direct emissions Metric tons CO 2 e 106,870 62,639 53,390 57,076 Market-based Scope 2 indirect emissions Metric tons CO 2 e 1,644,068 17,520 7,645 13,886 Total gross Scope 1 and location-based Scope 2 emissions Metric tons CO 2 e 1,750,939 80,159 61,035 70,963 Carbon offsets retired Metric tons CO 2 e 0 80,159 61,035 70,963 Total net Scope 1 and market-based Scope 2 emissions Metric tons CO 2 e 1,750,939 0 0 0 GRI : 305-1: Direct (Scope 1) GHG emissions; Reduction in total Scope 1 and market-based Scope 2 emissions Percent decrease from base year - 100% 100% 100% GRI : 305-2: Energy indirect (Scope 2) GHG emissions See above; more background on Making an impact, Environmental sustainability ; 2021 CDP Climate Change Report Scope 3 indirect emissions 17 Category 1 - purchased goods and services Metric tons CO 2 e - 1,864,660 1,613,395 1,436,100 Category 2 - capital goods Metric tons CO 2 e - 122,210 86,252 46,183 Category 3 - fuel- and energy-related activities Metric tons CO 2 e 325,236 143,002 123,011 141,748 Category 4 - upstream transportation and distribution Metric tons CO 2 e 243,881 140,215 116,149 124,780 Category 5 - waste (traditional disposal) Metric tons CO 2 e - 22,326 15,850 11,757
GREENHOUSE GAS EMISSIONS UNITS 2010 (baseline) 2019 2020 2021 Scope 3 indirect emissions Category 6 Business travel * Metric tons CO 2 e 195,126 161,748 31,481 18,822 Business travel carbon offsets retired Metric tons CO 2 e 0 0 31,482 18,823 Total net Scope 3 business travel emissions Metric tons CO 2 e 195,126 161,748 0 0 Category 7 - employee commuting** Metric tons CO 2 e 675,193 378,088 126,066 144,625 Category 8 - upstream leased assets Metric tons CO 2 e Not relevant Not relevant Not relevant Not relevant Category 9 - downstream transportation and distribution Metric tons CO 2 e - 1,400,000 1,200,000 1,000,000 Category 10 - processing of sold products Metric tons CO 2 e Not relevant Not relevant Not relevant Not relevant Category 11 - use of sold products Metric tons CO 2 e — 4,000 3,000 3,000 Category 12 - end of life treatment of sold products Metric tons CO 2 e — 16,000 12,000 9,000 Category 13 - downstream leased assets Metric tons CO 2 e Not relevant Not relevant Not relevant Not relevant Category 14 - franchises Metric tons CO 2 e Not Relevant Not Relevant Not Relevant Not Relevant Category 15 - investments*** Metric tons CO 2 e - - - - GRI: 305-3: Other indirect (Scope 3) GHG emission GRI 305-5: Reduction of GHG emission See above and also: Making an impact, Environmental sustainability ; 2021 CDP Climate Change Report We follow the WRI and WBCSD Greenhouse Gas Protocol Corporate Accounting and Reporting Standard to calculate Scope 1, 2 and 3 emissions. We use an operational control approach to define our boundary. The base year for emissions reductions is 2010; the rationale for choosing 2010 as the base year is that 2010 is the earliest year with complete, high quality data. Scope 1 and 2 calculations are based on site-specific data for fuel consumed and utilities purchased, applying published emissions factors and global warming potentials (GWPs). Scope 3 calculations are based on data for the relevant activity, applying published emissions factors and GWPs. Where actual data is not available, estimates are made based on actual data collected in prior years. The gases included in the calculation of Scope 1, 2 and 3 emissions are CO 2 , CH 4 , N 2 O, HFCs and PFCs. Our market-based greenhouse gas emissions include the impact o f renewable energy certificates (RECs) purchased in the U.S., Renewable Energy Guarantees of Origin (REGOs) purchased in the U.K., Guarantees of Origin (GOs) purchased in Spain and Ireland, J-Credits purchased f or Japan, PowerPlus purchased for India, and International RECs (I-RECs). All U.S. RECs purchased by Bank of America are Green-e certified. Emis sions reflect supplier-specific emission rates where available, all of which comply with Scope 2 Guidance criteria. Emissions reflect residual mix factors for European facilities. Residual mix factors are not currently available for facilities outside of Europe. Location-based emission factors are used to quantify electricity-related Scope 3 emissions. - Emissions are recalculated back to the base year when a change to a prior inventory would result in a change in emissions of 0.5% or greater. Therefore, prior year values shown in the current year of this report may not match the values published in prior reports. Impact of greenhouse gas emissions The societal impact of Scope 1, Scope 2 (location-based) and Scope 3 (categories 1-7, 9, 11-12) emissions in 2021 was estimated to be $183,345,000. This figure was calculated using the EP A’s 2020 cost of carbon of $51 / metric ton CO 2 (3% discount rate, reported in 2020 USD). *Impacted by the health and humanitarian crisis. **Calculated commuting emissions also include employee use of laptops and monitors at home due to the virtual posture in 2021. ***Relevant financed emissions will be published in our 2021 TCFD Response which will be released in September 2022. 18
CARBON OFFSETS PROJECT/PRODUCT Country Registry Vintage Type Quantify Applied 2010 2019 2020 2021 GreenTrees Reforestation Project United States American Carbon Registry 2015 Removal - 15,000 15,000 17, 000 Cordillera Azul REDD+ Project Peru IHS Markit 2015-2016 Avoidance - 24,337 47,557 17,000 TIST Small Group Tree Planting: Kenya, Uganda Uganda, Kenya Verra 2016-2017 Removal - 20,000 15,000 19,000 Katingan Peatland Restoration and Conservation Project Indonesia Verra 2017-2018 Avoidance - 20,000 15,000 36,786 Offsets are sourced from four projects: GreenTrees Reforestation Project, Cordillera Azul REDD+ Project, TIST Small Group Tree Planting: Kenya, Uganda, and the Katingan Peatland Restoration and Conservation Project. Offset retirements are subtracted from gross Scope 1 and market-based Scope 2 emissions, resulting in net Scope 1 and market-based Scope 2 emissions of zero. Offsets are also applied to Scope 3 Business Travel emissions, resulting in net Business Travel emissions of zero. Table represents sum of all offsets retired per year, which represents Scope 1, Scope 2, and Scope 3 Business Travel emissions. GREENHOUSE GAS EMISSIONS Units 2021 GROSS LOCATION-BASED EMISSIONS 2021 GROSS MARKET-BASED EMISSIONS Scope 1 direct emissions Scope 2 indirect emissions Total Scope 1 and Scope 2 emissions Scope 1 direct emissions Scope 2 indirect emissions Total Scope 1 and Scope 2 emissions BY REGION U.S. & Canada Metric tons CO 2 e 52,853 507,856 560,709 52,853 5,479 58,332 Asia Pacific Metric tons CO 2 e 645 73,813 74,458 645 7,718 8,363 Europe, Middle East and Africa (EMEA) Metric tons CO 2 e 3,552 18,700 22,251 3,552 444 3,996 Latin America Metric tons CO 2 e 27 1,538 1,565 27 245 272 19 GREENHOUSE GAS EMISSIONS BY COUNTRY United States Metric tons CO 2 e 52,829 507,706 560,535 52,829 5,479 58,308 India Metric tons CO 2 e 363 46,028 46,391 363 230 593 United Kingdom Metric tons CO 2 e 2,500 15,716 18,216 2,500 0 2,500 China Metric tons CO 2 e 150 10,912 11,062 150 234 384 Southeast Asia - Singapore, Malaysia, Philippines, Thailand, and Indonesia Metric tons CO 2 e 26 6,473 6,499 26 5,532 5,557 Japan Metric tons CO 2 e 30 4,895 4,924 30 1 31 Australia Metric tons CO 2 e 1 1,984 1,986 1 0 1
20 GREENHOUSE GAS EMISSIONS BY REGION Units Scope 1 direct emissions Scope 2 indirect emissions Total Scope 1 and Scope 2 emissions Scope 1 direct emissions Scope 2 indirect emissions Total Scope 1 and Scope 2 emissions 2021 GROSS LOCATION-BASED EMISSIONS 2021 GROSS MARKET-BASED EMISSIONS GREENHOUSE GAS EMISSIONS BY COUNTRY Ireland Metric tons CO 2 e 506 728 1,234 506 0 506 South Korea Metric tons CO 2 e 75 1,073 1,148 75 1,073 1,148 Taiwan Metric tons CO 2 e 8 1,092 1,100 8 642 650 Canada Metric tons CO 2 e 24 150 174 24 0 24 Rest of World Metric tons CO 2 e 565 5,149 5,714 565 696 1,260 Table shows the top 10 countries plus Canada with the highest total gross scope 1 and location-based scope 2 emissions. NOx, SOx, AND OTHER SIGNIFICANT AIR EMISSIONS FROM DIRECT COMBUSTION Units 2010 (baseline) 2019 2020 2021 SOx Metric tons 17 1 1 1 NOx Metric tons 44 20 19 19 CO Metric tons 56 32 27 27 VOC Metric tons 7 2 2 2 PM Metric tons 4 3 3 3 Ozone depleting substances Metric tons CFC-11e 3 2 3 3 Impact of air pollution $ USD - - 135,000 134,000 GRI 305-6: Emissions of ozone- depleting substances (ODS) GRI 305-7: Nitrogen oxides (NO X ), sulfur oxides (SO X ), and other significant air emissions See above and 2021 CDP Climate Change Report ; Making an impact, Environmental sustainability Data are sourced from the Scope 1 and 2 inventory and records kept through our compliance program. Significant air emissions are calculated based on site-specific data and published emission factors. We use the same boundary in calculating these air emissions as in our greenhouse gas emissions calculations. R-22 is an ozone depleting substance with a high global warming potential. BAC destroys R-22 from our operations when we decommission equipment instead of re-selling to encourage the complete phase out of R-22 from the market. The impact of air pollution (SOx, NOx, CO, VOCs, and PM) is calculated using social cost factors of each pollutant as reported in the World Resources Institute ’s Transport Emissions & Social Cost Assessment Tool v 1.0.
DIRECT AND INDIRECT ENERGY CONSUMPTION Units 2010 (baseline) 2019 2020 2021 Electricity Gigajoules 11,889,018 6,906,976 6,581,843 6,348,311 Other indirect (purchased steam and cooling) Gigajoules 200,907 153,249 155,049 151,197 Natural gas Gigajoules 1,488,556 894,254 752,984 758,595 Other direct (fuel oil, jet fuel, gasoline, diesel fuel, propane) Gigajoules 337,952 161,827 105,860 165,529 Total energy Gigajoules 13,916,433 8,116,305 7,595,737 7,423,632 Reduction in total energy GRI 302-4: Reduction of energy consumption Percent decrease from base year - 42% 45% 47% GRI : 302-1: Energy consumption within the organization See above. More info on Making an impact, Environmental sustainability ; 2021 CDP Climate Change Report . Data are sourced from utility bills where possible. Where utility bills are not available (such as in a leased property), we estimate based on internal estimation intensities by building type. These estimation intensities are calculated annually based on actual data. We use the same boundary in calculating energy consumption as in our greenhouse gas emissions calculations. ELECTRICITY FROM RENEWABLE SOURCES Units 2010 (baseline) 2019 2020 2021 Electricity consumption MWh 3,302,505 1,918,604 1,828,290 1,763,420 Total renewable electricity procured MWh 39,598 2,054,300 1,994,293 1,780,488 % of electricity from renewable sources % of electricity 1% 107% 109% 101% Bank of America adheres to certification, geography, technology, and project age standards when purchasing Renewable Energy Certificates (RECs), Renewable Energy Guarantees of Origin (REGOs), Guarantees of Origin (GOs), J-Credits, PowerPlus, and International RECs (I-RECS). 21
REDUCTIONS IN GREENHOUSE GAS EMISSIONS AND ENERGY CONSUMPTION Units 2010 (baseline) 2019 2020 2021 Projected annual emissions savings from reduction initiatives Metric tons CO 2 e - 2,933 3,670 10,994 Projected annual savings from energy efficiency measures Gigajoules - 33,762 39,788 109,467 GRI 302-5: Reductions in energy requirements of products and services See above; for more visit Making an impact, Environmental sustainability Data are sourced from records kept by Real Estate Services, which records each project undertaken and relevant details, including project annual electricity or fuel savings and projected annual monetary savings. Energy savings are estimated based on projections of project performance. Destroying R-22 Bank of America has made the decision to destroy R-22 from our operations when we decommission equipment instead of re-selling to encourage its complete phase out from the market. R-22 is an ozone depleting substance with a high global warming potential. CLIMATE-RELATED CAPITAL EXPENDITURE Units 2010 (baseline) 2019 2020 2021 Projected annual monetary investment on climate-related capital expenditure $ USD in thousands - - - 92,948 Includes capital expenditure on onsite solar panels and energy and water savings projects. Savings estimated based on projections of project performance and average cost of energy and water at sites where projects are implemented. INDIRECT ENERGY CONSUMPTION BY FUEL MIX Units 2010 (baseline) 2019 2020 2021 Coal % of mix 35% 19% 17% 14% Petroleum % of mix 3% 1% 1% 1% Natural gas % of mix 30% 42% 44% 46% Nuclear % of mix 23% 23% 22% 22% Renewable % of mix 9% 15% 16% 17% These data represent the mix of primary energy consumed to produce the intermediate energy (electricity, steam, chilled water) used. They represent primarily the mix of grid electricity sources provided by electricity suppliers, and thus are distinct from the above tracking of electricity from renewable sources, which represent the bank’s proactive purchase and implementation of renewable electricity. 22
INDIRECT ENERGY CONSUMPTION BY PRIMARY FUEL SOURCE Units 2010 (baseline) 2019 2020 2021 Coal Gigajoules 13,024,897 4,192,337 3,448,427 2,830,605 Petroleum Gigajoules 791,057 184,799 114,594 112,612 Natural gas Gigajoules 8,357,102 6,395,315 6,412,249 6,530,861 These data represent total source energy consumed to produce the intermediate energy (electricity, steam, chilled water) used. RENEWABLE MATERIAL USAGE - PAPER Units 2010 (baseline) 2019 2020 2021 Total usage Metric tons 65,501 39,262 28,594 26,788 Percent decrease from base year - 40% 56% 59% Recycle input materials by weight 8% 15% 14% 15% Certified input materials by weight - 99.3% 99.3% 98.6% GRI 301-1: Materials used by weight or volume GRI 301-2: Recycled input materials used Making an impact, Environmental sustainability . Also: in 2022, we announced that we will use 80% recycled plastic in credit and debit card production. For more, see newsroom.bankofamerica.com . Paper is purchased from external suppliers. Data are sourced from direct measurements based on invoices from our paper vendors. Purchased paper includes copy paper, commercial paper, paper office supplies, and janitorial paper. Janitorial paper included for the first time in 2021. We have a commitment to the procurement of environmentally and socially sustainable paper products. Details can be found in our Paper Procurement Policy. 23
WATER Units 2010 (baseline) 2019 2020 2021 Total water withdrawals Billion US gallons 3.54 1.99 1.77 1.67 Megaliters 13,410 7,517 6,689 6,325 Total potable water withdrawals GRI 303-3: water withdrawal Billion US gallons 3.52 1.95 1.74 1.64 Megaliters 13,331 7,398 6,599 6,223 Reduction in potable water withdrawals % decrease from base year - 45% 50% 53% Water withdrawals by source – Third- Party (municipal) Megaliters 13,410 7,423 6,624 6,243 % withdrawals 100% 98.8% 99.0% 98.7% Water withdrawals by source - Groundwater Megaliters - 14 16 - % withdrawals - 0.2% 0.2% - Water withdrawals by source – Surface Water (rainwater) Megaliters - 80 48 83 % withdrawals - 1.1% 0.7% 1.3% Total water consumption GRI 303-5: water consumption Billion US gallons 0.57 0.43 0.39 0.39 Megaliters 2,149 1,615 1,492 1,492 Estimated annual savings from water reduction projects Thousand US gallons - 46,303 23,913 8,455 GRI : 303-1: Interactions with water as a shared resource Water is withdrawn from municipal sources (except for a small amount of rainwater) and discharged to municipal sewer systems and their associated treatment facilities. For more: Making an impact, Environmental sustainability ; 2021 CDP Climate Change Report Third-party withdrawals and consumption from regions with high or extremely high baseline water stress Megaliters withdrawals - - 2,625 2,571 Megaliters consumption 619 680 % withdrawals 40% 41% % consumption 2 4 41% 46% Data for water withdrawals are sourced from utility bills where possible. Where utility bills are not available (such as in a leased property), we estimate based on internal estimation intensities by building type. These estimation intensities are calculated annually based on actual data. We use the same boundary in calculating water withdrawals as in our greenhouse gas emissions calculations. Water is withdrawn from municipal sources (except for a small amount of rainwater) and discharged to municipal sewer systems. Water consumption is equal to water used for irrigation. Data for groundwater and rainwater are sourced from meter readings for the systems in place. Potable water is defined as water treated to levels that meet state and federal standards for consumption. For BAC, this includes all water except grey water used for irrigation, untreated groundwater, and reclaimed water. Water values are recalculated back to the base year when a change to a prior inventory would result in a change in water values of 0.5% or greater. Therefore, prior year values shown in the current year of this report may not match the values published in prior reports. Baseline water stress is determined according to the WRI Aqueduct Water Risk Atlas tool.
WASTE UNITS DISPOSAL METHOD 2011 (baseline) 2019 2020 2021 E-waste disposed through certified vendors Percent certified 68% 100% 100% 100% Non-hazardous waste (office, confidential, construction and demolition, electronic, and other) Metric tons Landfill & incineration 60,370 43,032 29,115 21,957 Metric tons Recycling, compost & remarketing 68,217 59,929 47,126 44,818 Diversion rate 53% 58% 62% 67% Hazardous waste Metric tons Landfill & incineration 3 0.5 0.7 0.5 Metric tons Recycling, reuse & salvage 334 466 511 507 Diversion rate 99.2% 99.9% 99.9% 99.9% Construction & Demolition Waste Metric tons Landfill & incineration 12,523 12,860 7,939 5,478 Metric tons Recycling, reuse & salvage 18,046 21,781 18,969 14,654 Diversion rate 59% 63% 70% 73% Total waste GRI : 306-1: Waste generation and significant waste-related impacts GRI : 306-2: Management of significant waste-related impacts GRI : 306-3: Waste generated Metric tons Landfill & incineration 60,373 43,033 29,115 21,957 Metric tons Recycling & other diversion 68,551 60,395 47,637 45,325 Metric tons Total waste 128,924 103,428 76,752 67,282 Waste to landfill percent decrease from base year 2 N/A 29% 52% 64% Diversion rate 5 53% 58% 62% 67% The base year for waste data is 2011. Data are sourced where possible from vendors that provide waste removal services. Where weight data are not available (such as in a leased property), we estimate based on internal intensities by building type which were developed using actual data. We use the same boundary in calculating waste as in our greenhouse gas emissions calculations. The waste disposal method was determined from data provided by the waste vendors. Numbers may not sum exactly due to rounding. Regulated waste is reported on a 1-year lag, so the 2021 waste data includes regulated waste from 2020. Waste values are recalculated back to the base year when a change to a prior inventory would result in a change in water values of 0.5% or greater. Therefore, prior year values shown in the current year of this report may not match the values published in prior reports.
FACILITIES UNITS 2010 (baseline) 2019 2020 2021 26 LEED® (or comparable) certifications Net square feet 12,537,553 18,972,322 17,822,422 17,882,033 Percent of total square footage 10% 25% 24% 25% Land use and ecological sensitivity – U.S. GRI 304-1: Operational sites owned, leased, managed in, or adjacent to, protected areas and areas of high biodiversity value outside protected areas Sites that intersected with areas protected for biodiversity - - 9 10 Area of buildings (square meters) - - 6,900 7,120 FOOD UNITS (baseline) 2019 2020 2021 Cool Food Pledge Emissions Metric tons CO 2 e - - 4,403 Cool Food Pledge - reduction in total food-related emissions % reduction in total food-related emissions Not Available – this initiative launched in 2021 - - 44% Food Donations lbs - - - 26,401 Bank of America is part of the World Resources Institute (WRI) Cool Food Pledge, where companies pledge to provide delicious food that is better for the planet and commit to a collective target of reducing GHG emissions associated with the food they provide by 25% by 2030, relative to 2015. Emissions are calculated by WRI based on food types and amounts submitted by Bank of America. TRANSPORTATION UNITS 2010 (baseline) 2019 2020 2021 Electric vehicle charging Sites with charging stations - 57 57 56 Charging stations - 213 240 254 Support production and use of one billion gallons of SAF by 2030 # of gallons 1 billion N/A N/A N/A Total charging stations installed at Bank of America sites includes the cumulative number of global charging stations active in the reporting year. COMPLIANCE UNITS 2010 (baseline) 2019 2020 2021 Non-compliance with environmental regulations Value of monetary fines in $ USD 23,854 657 2,700 - Non-monetary violations 9 1 1 2 Reportable spills # of spills 2 0 3 1 Volume – US gallons 3 0 41 60
27 ENVIRONMENTAL SPEND UNITS 2010 (baseline) 2019 2020 2021 Total environmental protection spend Value of spend ($ USD in millions) - 15.1 14.5 15.8 GRI 307-1: Non-compliance with environmental laws and regulations. Refer to the disclosure of significant litigation, regulatory matters and material legal proceedings in Note 12 on pages 173–177 of the 2021 Financial Review (2021 Annual Report) . Data are sourced from our compliance management system, in which we record all instances of non-compliance with environmental regulations and spills; and spend with select third-party suppliers on environmental protection and compliance. SUPPLIER ENGAGEMENT UNITS 2010 (baseline) 2019 2020 2021 Suppliers invited to CDP Supply Chain # of suppliers 89 191 197 210 Spend invited to CDP Supply Chain information requests % of previous year’s spend - 73% 75% 75% Response rate to our CDP Supply Chain information requests % responded 84% 92% 90% 91% Suppliers reporting GHG emissions as part of CDP Supply Chain information requests % reporting emissions - 83% 86% 88% Suppliers reporting greenhouse gas or renewable energy targets as part of BAC CDP Supply Chain information requests % reporting targets - 65% 71% 73% Spend with suppliers who report GHG or renewable energy targets % of previous year’s spend - 44% 59% 61% Spend with suppliers assessed for ESG risks as outlined by our Vendor Code of Conduct GRI : 308-1: New suppliers that were screened using environmental criteria % of current year spend - - - 63% GRI 308-2: Negative environmental impacts in the supply chain and actions taken We sent the CDP (formerly Carbon Disclosure Project) Supply Chain Climate Questionnaire to 210 suppliers, which collectively represented 75% of our supply chain spend. 91% of these suppliers responded to the questionnaire. Additionally, as part of our supply chain monitoring process, all suppliers receive our Vendor Code of Conduct , which sets forth our expectations for human rights, labor and environmental standards throughout our global supply chain. W e monitor compliance with the code using a risk-based approach, which includes assessing our largest suppliers for ESG risk prior to contracting. Our contract templates include terms to ensure that our suppliers are obligated to comply with the expectations set forth in our code. Our selection process for inviting suppliers to the CDP Supply Chain survey takes into account both the environmental impact and spend with the supplier. Percent of spend metrics for greenhouse gas emissions reporting and greenhouse gas or renewable energy targets include information from both CDP and supplier-provided public reports. Diverting plastic waste In 2022, we became the first U.S.-based bank to commit to transition all plastic consumer and commercial credit and debit cards to at least 80% recycled plastic starting in 2023.
28 GRI Content Index Bank of America has reported the inf ormation cited in this GRI content index for the period January 1-December 31, 2021 with ref erence to the GRI Standards. Disclosure Page Location/Response 2-1 Organizational details Bank of America Corporation 2021 Annual Report, Financial highlights , About Bank of America- Our People, Our Passion, Our Purpose Direct Response : Certificate of Incorporation available at bankofamerica.com/investor 2-2 Entities included in the organization’s sustainability reporting 2021 Annual Report, Business segment operations 2-3 Reporting period, frequency and contact point Making an impact, Find resources , ESG reporting questions regarding the ESG content in our ESG reporting should be directed to ESG_Information@bofa.com . All other questions should be directed to Investor Relations 2-4 Restatements of information Re-statements are clearly marked throughout our reporting content 2-5 External assurance Environmental and Social Assurance Statement 2-6 Activities, value chain and other business relationships 2021 Annual Report, Business overview 2-7 Employees 3 2-8 Workers who are not employees Bank of America does not publicly disclose details on our contractors or the work they perform. 2-9 Governance structure and composition 7 2-10 Nomination and selection of the highest governance body 8 2-11 Chair of the highest governance body 7 2-12 Role of the highest governance body in overseeing the management of impacts 7 2-13 Delegation of responsibility for managing impacts 7 2-14 Role of the highest governance body in sustainability reporting 7 2-15 Conflicts of interest 7 2-16 Communication of critical concerns 7 2-17 Collective knowledge of the highest governance body 7 2-18 Evaluation of the performance of the highest governance body 8 2-19 Remuneration policies 8 2-20 Process to determine remuneration 8 2-21 Annual total compensation ratio 8 2-22 Statement on sustainable development strategy 8 2-23 Policy commitments 8 2-24 Embedding policy commitments 8 2-25 Processes to remediate negative impacts 8 2-26 Mechanisms for seeking advice and raising concerns 8 2-27 Compliance with laws and regulations 8 2-28 Membership associations 8 2-29 Approach to stakeholder engagement 9 2-30 Collective bargaining agreements 9 3-1 Process to determine material topics Making an impact, Find resources , ESGReporting , Materiality, Definition of Issues 3-2 List of material topics Making an impact, Materiality . Any significant changes are noted alongside data within our reporting content 3-3 Management of material topics We apply the precautionary approach to identifying and addressing longer-term environmental, social and governance issues that may impact our business, clients and communities, including global climate change and racial equality. Our commitment to specific policies, industry best practices and collaboration with external experts helps to inform our risk assessments in these areas. Disclosure Page Location/Response
29 201-1 Direct economic value generated and distributed 12 201-2 Financial implications and other risks and opportunities due to climate change 12 201-3 Defined benefit plan obligations and other retirement plans 12 201-4 Financial assistance received from government 12 202-1 Ratios of standard entry level wage by gender compared to local minimum wage N/A or omitted 202-2 Proportion of senior management hired from the local community N/A or omitted 203-1 Infrastructure investments and services supported 10 203-2 Significant indirect economic impacts 12 204-1 Proportion of spending on local suppliers N/A or omitted 205-1 Operations assessed for risks related to corruption 9 205-2 Communication and training about anti-corruption policies and procedures 9 205-3 Confirmed incidents of corruption and actions taken N/A or omitted 206-1 Legal actions for anti-competitive behavior, anti-trust, and monopoly practices N/A or omitted 207-1 Approach to tax N/A or omitted 207-2 Tax governance, control, and risk management N/A or omitted 207-3 Stakeholder engagement and management of concerns related to tax N/A or omitted 207-4 Country-by-country reporting N/A or omitted 301-1 Materials used by weight or volume 23 301-2 Recycled input materials used 23 301-3 Reclaimed products and their packaging materials N/A or omitted 302-1 Energy consumption within the organization 21 302-2 Energy consumption outside of the organization N/A or omitted 302-3 Energy intensity N/A or omitted 302-4 Reduction of energy consumption 21 302-5 Reductions in energy requirements of products and services 22 303-1 Interactions with water as a shared resource N/A or omitted 303-2 Management of water discharge-related impacts N/A or omitted 303-3 Water withdrawal 24 303-4 Water discharge N/A or omitted 303-5 Water consumption 24 304-1 Operational sites owned, leased, managed in, or adjacent to, protected areas and areas of high biodiversity value outside protected areas 26 304-2 Significant impacts of activities, products and services on biodiversity N/A or omitted 304-3 Habitats protected or restored N/A or omitted 304-4 IUCN Red List species and national conservation list species with habitats in areas affected by operations N/A or omitted 305-1 Direct (Scope 1) GHG emissions 17 305-2 Energy indirect (Scope 2) GHG emissions 17 305-3 Other indirect (Scope 3) GHG emissions 18 305-4 GHG emissions intensity N/A or omitted 305-5 Reduction of GHG emissions 18 305-6 Emissions of ozone-depleting substances (ODS) 20 305-7 Nitrogen oxides (NOx), sulfur oxides (SOx), and other significant air emissions 20 306-1 Waste generation and significant waste-related impacts 25 306-2 Management of significant waste-related impacts 25 306-3 Waste generated 25 306-4 Waste diverted from disposal N/A or omitted 306-5 Waste directed to disposal N/A or omitted 308-1 New suppliers that were screened using environmental criteria 27 308-2 Negative environmental impacts in the supply chain and actions taken 27 401-1 New employee hires and employee turnover 3 Disclosure Page Location/Response Disclosure Page Location/Response
30 401-2 Benefits provided to full-time employees that are not provided to temporary or part-time employees 3 401-3 Parental leave 3 402-1 Minimum notice periods regarding operational changes N/A or omitted 403-1 Occupational health and safety management system 4 403-2 Hazard identification, risk assessment, and incident investigation 4 403-3 Occupational health services 4 403-4 Worker participation, consultation, and communication on occupational health and safety 4 403-5 Worker training on occupational health and safety 5 403-6 Promotion of worker health 5 403-7 Prevention and mitigation of occupational health and safety impacts directly linked by business relationships 5 403-8 Workers covered by an occupational health and safety management system 5 403-9 Work-related injuries N/A or omitted 403-10 Work-related ill health N/A or omitted 404-1 Average hours of training per year per employee 5 404-2 Programs for upgrading employee skills and transition assistance programs 5 404-3 Percentage of employees receiving regular performance and career development reviews 5 405-1 Diversity of governance bodies and employees 5 405-2 Ratio of basic salary and remuneration of women to men 5 406-1 Incidents of discrimination and corrective actions taken N/A or omitted 407-1 Operations and suppliers in which the right to freedom of association and collective bargaining may be at risk 12 408-1 Operations and suppliers at significant risk for incidents of child labor 2021 Modern Slavery Act Statement 409-1 Operations and suppliers at significant risk for incidents of forced or compulsory labor 2021 Modern Slavery Act Statement 410-1 Security personnel trained in human rights policies or procedures 2021 Modern Slavery Act Statement 411-1 Incidents of violations involving rights of indigenous peoples N/A or omitted 413-1 Operations with local community engagement, impact assessments, and development programs 11 413-2 Operations with significant actual and potential negative impacts on local communities N/A or omitted 414-1 New suppliers that were screened using social criteria 12 414-2 Negative social impacts in the supply chain and actions taken 2021 Modern Slavery Act Statement 415-1 Political contributions 9 416-1 Assessment of the health and safety impacts of product and service categories N/A or omitted 416-2 Incidents of non-compliance concerning the health and safety impacts of products and services N/A or omitted 417-1 Requirements for product and service information and labeling 9 417-2 Incidents of non-compliance concerning product and service information and labeling 9 417-3 Incidents of non-compliance concerning marketing communications 9 418-1 Substantiated complaints concerning breaches of customer privacy and losses of customer data 9 Disclosure Page Location/Response Disclosure Page Location/Response