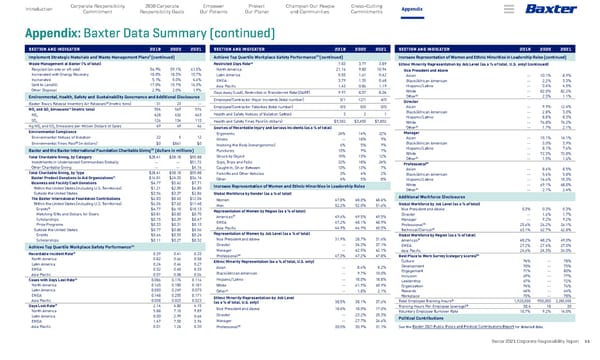
Baxter 2021 Corporate Responsibility Report 55 Appendix 2030 Corporate Responsibility Goals Corporate Responsibility Commitment Empower Our Patients Protect Our Planet Champion Our People and Communities Introduction Cross-Cutting Commitments Appendix: Baxter Data Summary (continued) SECTION AND INDICATOR 2019 2020 2021 Implement Strategic Materials and Waste Management Plans 5 (continued) Waste Management at Baxter (% of total) Recycled (on-site or off-site) 56.9% 59.1% 61.5% Incinerated with Energy Recovery 18.0% 18.3% 15.7% Incinerated 5.1% 5.0% 4.6% Sent to Landfill 17.0% 15.7% 16.3% Other Disposal 2.9% 2.0% 1.9% Environmental, Health, Safety and Sustainability Governance and Additional Disclosures Baxter Toxics Release Inventory Air Releases 18 (metric tons) 31 23 -- NO x and SO x Emissions 19 (metric tons) 554 569 576 NO x 428 436 463 SO x 126 134 113 Kg NO x and SO x Emissions per Million Dollars of Sales 49 49 46 Environmental Compliance Environmental Notices of Violation 22 5 12 Environmental Fines Paid 20 (in dollars) $0 $861 $0 Baxter and the Baxter International Foundation Charitable Giving 21 (dollars in millions) Total Charitable Giving, by Category $28.41 $38.18 $55.88 Investments in Underserved Communities Globally -- -- $51.72 Other Charitable Giving -- -- $4.16 Total Charitable Giving, by Type $28.41 $38.18 $55.88 Baxter Product Donations to Aid Organizations 22 $16.81 $24.33 $36.14 Business and Facility Cash Donations $4.77 $5.42 $7.71 Within the United States (including U.S. Territories) $1.21 $2.05 $4.85 Outside the United States $3.56 $3.37 $2.86 The Baxter International Foundation Contributions $6.83 $8.43 $12.04 Within the United States (including U.S. Territories) $6.06 $7.63 $11.48 Grants 23 $4.77 $6.10 $10.13 Matching Gifts and Dollars for Doers $0.81 $0.83 $0.75 Scholarships $0.15 $0.39 $0.47 Prize Programs $0.33 $0.31 $0.13 Outside the United States $0.77 $0.80 $0.56 Grants $0.66 $0.53 $0.24 Scholarships $0.11 $0.27 $0.32 Achieve Top Quartile Workplace Safety Performance 24 Recordable Incident Rate 25 0.39 0.41 0.33 North America 0.82 0.66 0.58 Latin America 0.24 0.46 0.27 EMEA 0.32 0.40 0.33 Asia Pacific 0.07 0.08 0.06 Cases with Days Lost Rate 26 0.086 0.174 0.116 North America 0.165 0.180 0.181 Latin America 0.000 0.249 0.073 EMEA 0.148 0.255 0.171 Asia Pacific 0.008 0.023 0.023 Days Lost Rate 27 2.14 4.80 4.15 North America 5.88 7.10 9.89 Latin America 0.00 2.99 0.64 EMEA 1.47 7.50 3.96 Asia Pacific 0.01 1.24 0.30 SECTION AND INDICATOR 2019 2020 2021 Achieve Top Quartile Workplace Safety Performance 24 (continued) Restricted Days Rate 28 7.83 3.77 3.89 North America 21.16 9.80 10.94 Latin America 0.55 1.61 0.42 EMEA 3.79 1.35 0.68 Asia Pacific 1.43 0.86 1.19 Days Away (Lost), Restricted or Transferred Rate (DART) 9.97 8.57 8.04 Employee/Contractor Major Incidents (total number) 5/1 12/1 4/0 Employee/Contractor Fatalities (total number) 0/0 0/0 0/0 Health and Safety Notices of Violation Settled 3 2 1 Health and Safety Fines Paid (in dollars) $9,382 $3,450 $7,802 Sources of Recordable Injury and Serious Incidents (as a % of total) Ergonomic 24% 14% 22% Illness -- 18% 9% Involving the Body (nonergonomic) 6% 5% 9% Punctures 13% 9% 7% Struck by Object 15% 13% 12% Slips, Trips and Falls 22% 18% 24% Caught In, On or Between 13% 13% 7% Forklifts and Other Vehicles 3% 4% 2% Other 4% 5% 8% Increase Representation of Women and Ethnic Minorities in Leadership Roles Global Workforce by Gender (as a % of total) Women 47.8% 48.0% 48.4% Men 52.2% 52.0% 51.6% Representation of Women by Region (as a % of total) Americas 29 49.6% 49.5% 49.5% EMEA 47.2% 48.1% 48.9% Asia Pacific 44.9% 44.9% 45.5% Representation of Women by Job Level (as a % of total) Vice President and Above 31.9% 28.7% 31.6% Director -- 34.3% 37.1% Manager -- 42.5% 42.1% Professional 30 47.3% 47.2% 47.8% Ethnic Minority Representation (as a % of total, U.S. only) Asian -- 8.6% 8.2% Black/African American -- 9.7% 10.0% Hispanic/Latino -- 18.0% 18.8% White -- 61.9% 60.9% Other 31 -- 1.8% 2.1% Ethnic Minority Representation by Job Level (as a % of total, U.S. only) 38.5% 38.1% 37.6% Vice President and Above 18.4% 18.0% 17.0% Director -- 23.2% 25.3% Manager -- 27.7% 26.6% Professional 30 30.0% 30.9% 31.1% SECTION AND INDICATOR 2019 2020 2021 Increase Representation of Women and Ethnic Minorities in Leadership Roles (continued) Ethnic Minority Representation by Job Level (as a % of total, U.S. only) (continued) Vice President and Above Asian -- 10.1% 8.9% Black/African American -- 2.2% 3.3% Hispanic/Latino -- 3.4% 4.5% White -- 82.0% 82.2% Other 31 -- 2.3% 1.1% Director Asian -- 9.9% 12.4% Black/African American -- 2.8% 3.0% Hispanic/Latino -- 8.8% 8.3% White -- 76.8% 74.2% Other 31 -- 1.7% 2.1% Manager Asian -- 15.1% 14.1% Black/African American -- 3.0% 3.9% Hispanic/Latino -- 8.1% 7.6% White -- 72.3% 72.8% Other 31 -- 1.5% 1.6% Professional 30 Asian -- 8.6% 8.5% Black/African American -- 5.6% 5.8% Hispanic/Latino -- 14.6% 15.3% White -- 69.1% 68.0% Other 31 -- 2.1% 2.4% Additional Workforce Disclosures Global Workforce by Job Level (as a % of total) Vice President and Above 0.3% 0.3% 0.3% Director -- 1.6% 1.7% Manager -- 9.2% 9.2% Professional 30 25.6% 26.2% 26.1% Technical/Clerical 32 63.1% 62.7% 62.8% Global Workforce by Region (as a % of total) Americas 29 48.2% 48.2% 49.0% EMEA 27.2% 27.4% 27.0% Asia Pacific 24.6% 24.3% 24.0% Best Place to Work Survey (category scores) 33 Culture 74% -- 78% Development 70% -- 75% Engagement 71% -- 80% Inclusion 69% -- 77% Leadership 67% -- 72% Organization 74% -- 76% Rewards 64% -- 64% Workplace 73% -- 78% Total Employee Training Hours 34 1,920,000 950,000 2,200,000 Training Hours Per Employee (average) 34 38.4 18 30 Voluntary Employee Turnover Rate 10.7% 9.2% 14.0% Political Contributions See the Baxter 2021 Public Policy and Political Contributions Report for detailed data.
 Baxter Corporate Responsibility Report Page 54 Page 56