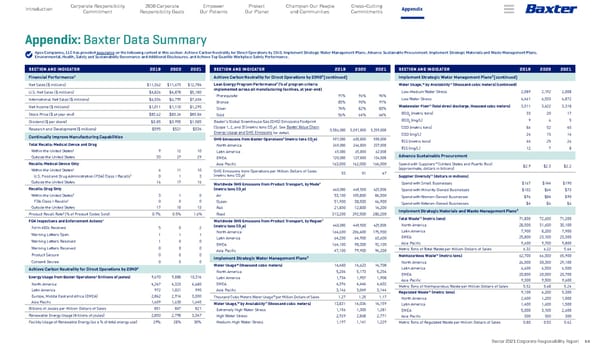
Baxter 2021 Corporate Responsibility Report 54 Appendix 2030 Corporate Responsibility Goals Corporate Responsibility Commitment Empower Our Patients Protect Our Planet Champion Our People and Communities Introduction Cross-Cutting Commitments Appendix: Baxter Data Summary SECTION AND INDICATOR 2019 2020 2021 Financial Performance 1 Net Sales ($ millions) $11,362 $11,673 $12,784 U.S. Net Sales ($ millions) $4,826 $4,878 $5,180 International Net Sales ($ millions) $6,536 $6,795 $7,604 Net Income ($ millions) $1,011 $1,110 $1,295 Stock Price ($ at year end) $83.62 $80.24 $85.84 Dividend ($ per share) $0.85 $0.955 $1.085 Research and Development ($ millions) $595 $521 $534 Continually Improve Manufacturing Capabilities Total Recalls: Medical Device and Drug Within the United States 2 9 12 10 Outside the United States 33 27 29 Recalls: Medical Device Only Within the United States 2 6 11 10 U.S. Food and Drug Administration (FDA) Class I Recalls 2 0 1 3 Outside the United States 16 17 16 Recalls: Drug Only Within the United States 2 3 1 0 FDA Class I Recalls 2 0 0 0 Outside the United States 17 10 13 Product Recall Rate 3 (% of Product Codes Sold) 0.7% 0.5% 1.6% FDA Inspections and Enforcement Actions 4 Form 483s Received 5 0 2 Warning Letters Open 1 1 1 Warning Letters Resolved 1 0 0 Warning Letters Received 0 0 0 Product Seizure 0 0 0 Consent Decree 0 0 0 Achieve Carbon Neutrality for Direct Operations by 2040 5 Energy Usage from Baxter Operations 6 (trillions of joules) 9,670 9,888 10,316 North America 4,247 4,323 4,680 Latin America 972 1,021 990 Europe, Middle East and Africa (EMEA) 2,842 2,914 3,000 Asia Pacific 1,609 1,630 1,645 Billions of Joules per Million Dollars of Sales 851 847 821 Renewable Energy Usage (trillions of joules) 2,850 2,798 3,047 Facility Usage of Renewable Energy (as a % of total energy use) 29% 28% 30% SECTION AND INDICATOR 2019 2020 2021 Achieve Carbon Neutrality for Direct Operations by 2040 5 (continued) Lean Energy Program Performance 7 (% of program criteria implemented across all manufacturing facilities, at year-end) Prerequisite 91% 96% 96% Bronze 85% 90% 91% Silver 74% 82% 83% Gold 56% 64% 64% Baxter’s Global Greenhouse Gas (GHG) Emissions Footprint (Scope 1, 2, and 3) (metric tons CO 2 e). See Baxter Value Chain Energy Usage and GHG Emissions for detail. 5,586,000 5,091,000 5,259,000 GHG Emissions from Baxter Operations 8 (metric tons CO 2 e) 597,000 600,000 598,000 North America 249,000 246,000 237,000 Latin America 65,000 65,000 62,000 EMEA 120,000 127,000 134,000 Asia Pacific 163,000 162,000 164,000 GHG Emissions from Operations per Million Dollars of Sales (metric tons CO 2 e) 53 51 47 Worldwide GHG Emissions from Product Transport, by Mode 9 (metric tons CO 2 e) 440,000 449,500 425,800 Air 53,100 105,800 84,500 Ocean 51,900 38,500 46,900 Rail 21,800 12,800 14,200 Road 313,200 292,500 280,200 Worldwide GHG Emissions from Product Transport, by Region 9 (metric tons CO 2 e) 440,000 449,500 425,800 North America 164,600 206,400 175,900 Latin America 64,200 64,900 63,600 EMEA 164,100 98,300 92,100 Asia Pacific 47,100 79,900 94,200 Implement Strategic Water Management Plans 5 Water Usage 10 (thousand cubic meters) 14,480 14,623 14,708 North America 5,204 5,173 5,254 Latin America 1,734 1,957 1,908 EMEA 4,396 4,444 4,402 Asia Pacific 3,146 3,049 3,144 Thousand Cubic Meters Water Usage 10 per Million Dollars of Sales 1.27 1.25 1.17 Water Usage, 10 by Availability 11 (thousand cubic meters) 13,831 14,034 14,159 Extremely High Water Stress 1,156 1,300 1,281 High Water Stress 2,929 2,868 2,771 Medium-High Water Stress 1,197 1,141 1,229 SECTION AND INDICATOR 2019 2020 2021 Implement Strategic Water Management Plans 5 (continued) Water Usage, 10 by Availability 11 (thousand cubic meters) (continued) Low-Medium Water Stress 2,089 2,192 2,008 Low Water Stress 6,461 6,533 6,872 Wastewater Flow 12 (total direct discharge, thousand cubic meters) 3,511 3,422 3,318 BOD 5 (metric tons) 33 20 17 BOD 5 (mg/L) 9 6 5 COD (metric tons) 86 52 45 COD (mg/L) 24 15 14 TSS (metric tons) 44 25 26 TSS (mg/L) 12 7 8 Advance Sustainable Procurement Spend with Suppliers 13 (United States and Puerto Rico) (approximate, dollars in billions) $2.9 $2.3 $2.2 Supplier Diversity 14 (dollars in millions) Spend with Small Businesses $167 $144 $190 Spend with Minority-Owned Businesses $102 $64 $73 Spend with Women-Owned Businesses $96 $84 $90 Spend with Veteran-Owned Businesses $4 $6 $6 Implement Strategic Materials and Waste Management Plans 5 Total Waste 15 (metric tons) 71,800 72,600 71,200 North America 28,500 31,600 30,100 Latin America 7,900 8,200 7,900 EMEA 25,800 23,100 23,300 Asia Pacific 9,600 9,700 9,800 Metric Tons of Total Waste per Million Dollars of Sales 6.32 6.22 5.66 Nonhazardous Waste 16 (metric tons) 62,700 66,300 65,900 North America 26,000 30,300 29,100 Latin America 6,600 6,500 6,500 EMEA 20,800 20,000 20,700 Asia Pacific 9,300 9,500 9,600 Metric Tons of Nonhazardous Waste per Million Dollars of Sales 5.52 5.68 5.24 Regulated Waste 17 (metric tons) 9,100 6,200 5,300 North America 2,400 1,200 1,000 Latin America 1,400 1,600 1,500 EMEA 5,000 3,100 2,600 Asia Pacific 300 300 300 Metric Tons of Regulated Waste per Million Dollars of Sales 0.80 0.53 0.42 Apex Companies, LLC has provided assurance on the following content in this section: Achieve Carbon Neutrality for Direct Operations by 2040; Implement Strategic Water Management Plans; Advance Sustainable Procurement; Implement Strategic Materials and Waste Management Plans; Environmental, Health, Safety and Sustainability Governance and Additional Disclosures; and Achieve Top Quartile Workplace Safety Performance.
 Baxter Corporate Responsibility Report Page 53 Page 55