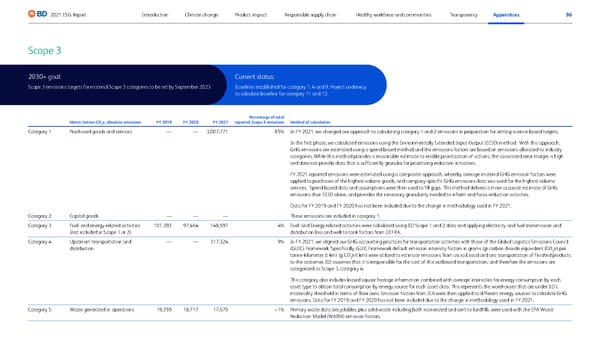
96 2021 ESG Report Transparency Appendices Responsible supply chain Product impact Climate change Introduction Healthy workforce and communities 2030+ goal: Scope 3 emissions targets for material Scope 3 categories to be set by September 2023 Current status: Baselines established for category 1, 4 and 9. Project underway to calculate baseline for category 11 and 12. Scope 3 Metric tonnes CO 2 e, absolute emissions FY 2019 FY 2020 FY 2021 Percentage of total reported Scope 3 emissions Method of calculation Category 1 Purchased goods and services — — 3,007,771 85% In FY 2021, we changed our approach to calculating category 1 and 2 emissions in preparation for setting science-based targets. In the first phase, we calculated emissions using the Environmentally Extended Input-Output (EEIO) method. With this approach, GHG emissions are estimated using a spend-based method and the emissions factors are based on emissions allocated to industry categories. While this method provides a reasonable estimate to enable prioritization of actions, the associated error margin is high and does not provide data that is sufficiently granular for prioritizing reduction initiatives. FY 2021 reported emissions were estimated using a composite approach, whereby average material GHG emission factors were applied to purchases of the highest-volume goods, and company-specific GHG emissions data was used for the highest-volume services. Spend-based data and assumptions were then used to fill gaps. This method delivers a more accurate estimate of GHG emissions than EEIO alone, and provides the necessary granularity needed to inform and focus reduction activities. Data for FY 2019 and FY 2020 has not been included due to the change in methodology used in FY 2021. Category 2 Capital goods — — — These emissions are included in category 1. Category 3 Fuel- and energy-related activities (not included in Scope 1 or 2) 101,392 97,464 148,597 4% Fuel- and Energy-related activities were calculated using BD Scope 1 and 2 data and applying electricity and fuel transmission and distribution loss and well-to-tank factors from DEFRA. Category 4 Upstream transportation and distribution — — 317,324 9% In FY 2021, we aligned our GHG accounting practices for transportation activities with those of the Global Logistics Emissions Council (GLEC) Framework. Specifically, GLEC Framework default emission-intensity factors in grams (g) carbon dioxide equivalent (CO 2 e) per tonne-kilometer (t-km) (g CO 2 e/t-km) were utilized to estimate emissions from air, rail, road and sea transportation of finished products to the customer. BD assumes that it is rresponsible for the cost of this outbound transportation, and therefore the emissions are categorized as Scope 3, category 4. This category also includes leased square footage information combined with average intensities for energy consumption by each asset type to obtain total consumption by energy source for each asset class. This represents the warehouses that are under BD’s materiality threshold in terms of floor area. Emission factors from IEA were then applied to different energy sources to calculate GHG emissions. Data for FY 2019 and FY 2020 has not been included due to the change in methodology used in FY 2021. Category 5 Waste generated in operations 19,359 18,717 17,675 <1% Primary waste data (recyclables, plus solid waste including both incinerated and sent to landfill), were used with the EPA Waste Reduction Model (WARM) emission factors.
 BD ESG Report Page 95 Page 97