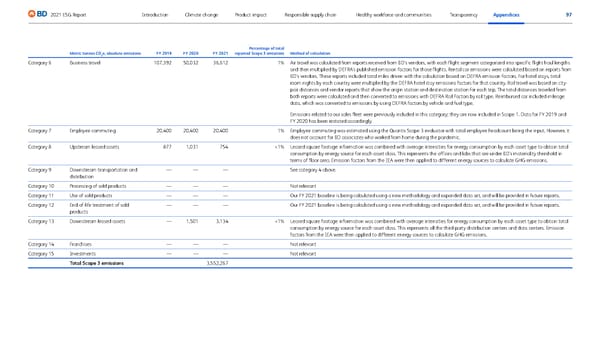
97 2021 ESG Report Transparency Appendices Responsible supply chain Product impact Climate change Introduction Healthy workforce and communities Metric tonnes CO 2 e, absolute emissions FY 2019 FY 2020 FY 2021 Percentage of total reported Scope 3 emissions Method of calculation Category 6 Business travel 107,392 50,032 36,612 1% Air travel was calculated from reports received from BD’s vendors, with each flight segment categorized into specific flight haul lengths and then multiplied by DEFRA’s published emission factors for those flights. Rental car emissions were calculated based on reports from BD’s vendors. These reports included total miles driven with the calculation based on DEFRA emission factors. For hotel stays, total room nights by each country were multiplied by the DEFRA hotel stay emissions factors for that country. Rail travel was based on city- pair distances and vendor reports that show the origin station and destination station for each trip. The total distances traveled from both reports were calculated and then converted to emissions with DEFRA Rail Factors by rail type. Reimbursed car included mileage data, which was converted to emissions by using DEFRA factors by vehicle and fuel type. Emissions related to our sales fleet were previously included in this category; they are now included in Scope 1. Data for FY 2019 and FY 2020 has been restated accordingly. Category 7 Employee commuting 20,400 20,400 20,400 1% Employee commuting was estimated using the Quantis Scope 3 evaluator with total employee headcount being the input. However, it does not account for BD associates who worked from home during the pandemic. Category 8 Upstream leased assets 877 1,031 754 <1% Leased square footage information was combined with average intensities for energy consumption by each asset type to obtain total consumption by energy source for each asset class. This represents the offices and labs that are under BD’s materiality threshold in terms of floor area. Emission factors from the IEA were then applied to different energy sources to calculate GHG emissions. Category 9 Downstream transportation and distribution — — — See category 4 above. Category 10 Processing of sold products — — — Not relevant Category 11 Use of sold products — — — Our FY 2021 baseline is being calculated using a new methodology and expanded data set, and will be provided in future reports. Category 12 End-of-life treatment of sold products — — — Our FY 2021 baseline is being calculated using a new methodology and expanded data set, and will be provided in future reports. Category 13 Downstream leased assets — 1,501 3,134 <1% Leased square footage information was combined with average intensities for energy consumption by each asset type to obtain total consumption by energy source for each asset class. This represents all the third-party distribution centers and data centers. Emission factors from the IEA were then applied to different energy sources to calculate GHG emissions. Category 14 Franchises — — — Not relevant Category 15 Investments — — — Not relevant Total Scope 3 emissions 3,552,267
 BD ESG Report Page 96 Page 98