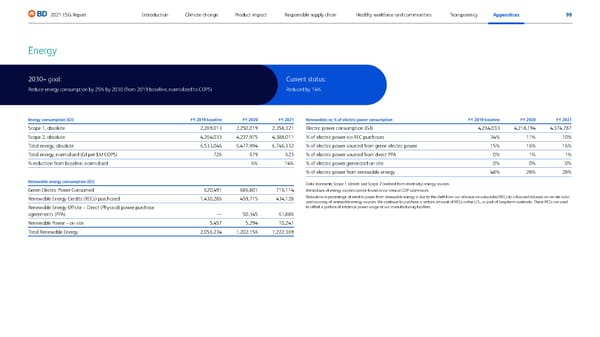
98 2021 ESG Report Transparency Appendices Responsible supply chain Product impact Climate change Introduction Healthy workforce and communities 2030+ goal: Reduce energy consumption by 25% by 2030 (from 2019 baseline, normalized to COPS) Current status: Reduced by 14% Energy Energy consumption (GJ) FY 2019 baseline FY 2020 FY 2021 Scope 1, absolute 2,269,013 2,250,019 2,358,321 Scope 2, absolute 4,264,033 4,227,975 4,388,011 Total energy, absolute 6,533,046 6,477,994 6,746,332 Total energy, normalized (GJ per $M COPS) 726 679 623 % reduction from baseline, normalized 6% 14% Renewable energy consumption (GJ) Green Electric Power Consumed 620,491 686,801 716,114 Renewable Energy Credits (RECs) purchased 1,430,286 459,715 434,128 Renewable Energy Offsite – Direct (Physical) power purchase agreements (PPA) — 50,345 61,886 Renewable Power – on-site 5,457 5,294 10,241 Total Renewable Energy 2,056,234 1,202,156 1,222,369 Renewables as % of electric power consumption FY 2019 baseline FY 2020 FY 2021 Electric power consumption (GJ) 4,264,033 4,218,194 4,374,787 % of electric power via REC purchases 34% 11% 10% % of electric power sourced from green electric power 15% 16% 16% % of electric power sourced from direct PPA 0% 1% 1% % of electric power generated on-site 0% 0% 0% % of electric power from renewable energy 48% 28% 28% Data represents Scope 1 (direct) and Scope 2 (indirect from electricity) energy sources. Breakdown of energy sources can be found in our annual CDP submission. Reduction in percentage of electric power from renewable energy is due to the shift from our reliance on unbundled RECs to a focused reliance on on-site solar and sourcing of renewable energy sources. We continue to purchase a certain amount of RECs in the U.S., as part of long-term contracts. These RECs are used to offset a portion of electrical power usage at our manufacturing facilities.
 BD ESG Report Page 97 Page 99