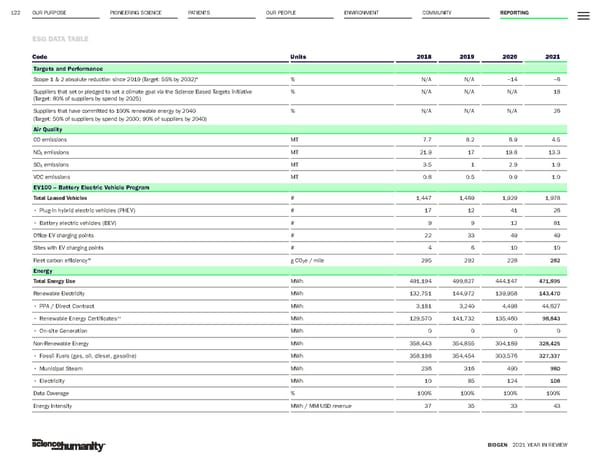
OUR PURPOSE PIONEERING SCIENCE 122 ESG DATA TABLE BIOGEN 2021 YEAR IN REVIEW PATIENTS OUR PEOPLE ENVIRONMENT COMMUNITY REPORTING Code Units 2018 2019 2020 2021 Targets and Performance Scope 1 & 2 absolute reduction since 2019 (Target: 55% by 2032) 4 % N/A N/A –14 –6 Suppliers that set or pledged to set a climate goal via the Science Based Targets initiative (Target: 80% of suppliers by spend by 2025) % N/A N/A N/A 18 Suppliers that have committed to 100% renewable energy by 2040 (Target: 50% of suppliers by spend by 2030; 90% of suppliers by 2040) % N/A N/A N/A 26 Air Quality CO emissions MT 7.7 8.2 6.9 4.5 NO X emissions MT 21.9 17 19.8 13.3 SO X emissions MT 3.5 1 2.9 1.9 VOC emissions MT 0.8 0.5 0.9 1.0 EV100 – Battery Electric Vehicle Program Total Leased Vehicles # 1,447 1,469 1,929 1,978 • Plug-in hybrid electric vehicles (PHEV) # 17 12 41 26 • Battery electric vehicles (BEV) # 9 9 12 81 Office EV charging points # 22 33 49 49 Sites with EV charging points # 4 6 10 10 Fleet carbon efficiency 10 g CO 2 e / mile 295 292 228 282 Energy Total Energy Use MWh 491,194 499,827 444,147 471,895 Renewable Electricity MWh 132,751 144,972 139,958 143,470 • PPA / Direct Contract MWh 3,181 3,240 4,498 44,627 • Renewable Energy Certificates 11 MWh 129,570 141,732 135,460 98,843 • On-site Generation MWh 0 0 0 0 Non-Renewable Energy MWh 358,443 354,855 304,189 328,425 • Fossil Fuels (gas, oil, diesel, gasoline) MWh 358,198 354,454 303,576 327,337 • Municipal Steam MWh 236 316 490 980 • Electricity MWh 10 85 124 108 Data Coverage % 100% 100% 100% 100% Energy Intensity MWh / MM USD revenue 37 35 33 43
 Biogen Year In Review Page 121 Page 123