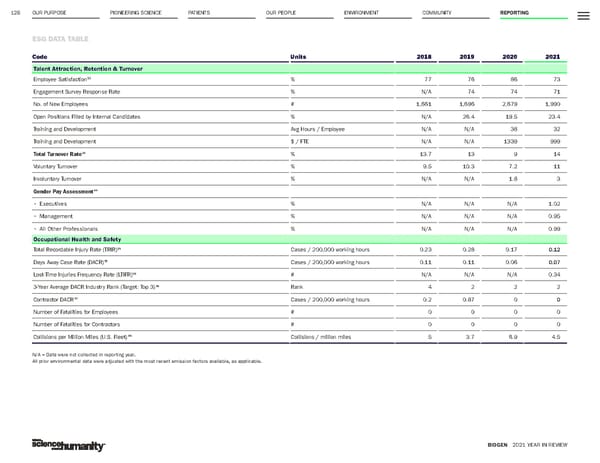
OUR PURPOSE PIONEERING SCIENCE 126 ESG DATA TABLE BIOGEN 2021 YEAR IN REVIEW PATIENTS OUR PEOPLE ENVIRONMENT COMMUNITY REPORTING Code Units 2018 2019 2020 2021 Talent Attraction, Retention & Turnover Employee Satisfaction 32 % 77 76 86 73 Engagement Survey Response Rate % N/A 74 74 71 No. of New Employees # 1,661 1,696 2,679 1,990 Open Positions Filled by Internal Candidates % N/A 26.4 19.5 23.4 Training and Development Avg Hours / Employee N/A N/A 38 32 Training and Development $ / FTE N/A N/A 1339 999 Total Turnover Rate 33 % 13.7 13 9 14 Voluntary Turnover % 9.5 10.3 7.2 11 Involuntary Turnover % N/A N/A 1.8 3 Gender Pay Assessment 34 • Executives % N/A N/A N/A 1.02 • Management % N/A N/A N/A 0.95 • All Other Professionals % N/A N/A N/A 0.99 Occupational Health and Safety Total Recordable Injury Rate (TRIR) 35 Cases / 200,000 working hours 0.23 0.28 0.17 0.12 Days Away Case Rate (DACR) 35 Cases / 200,000 working hours 0.11 0.11 0.06 0.07 Lost-Time Injuries Frequency Rate (LTIFR) 35 # N/A N/A N/A 0.34 3-Year Average DACR Industry Rank (Target: Top 3) 36 Rank 4 2 2 2 Contractor DACR 37 Cases / 200,000 working hours 0.2 0.87 0 0 Number of Fatalities for Employees # 0 0 0 0 Number of Fatalities for Contractors # 0 0 0 0 Collisions per Million Miles (U.S. Fleet) 38 Collisions / million miles 5 3.7 6.9 4.5 N/A = Data were not collected in reporting year. All prior environmental data were adjusted with the most recent emission factors available, as applicable.
 Biogen Year In Review Page 125 Page 127