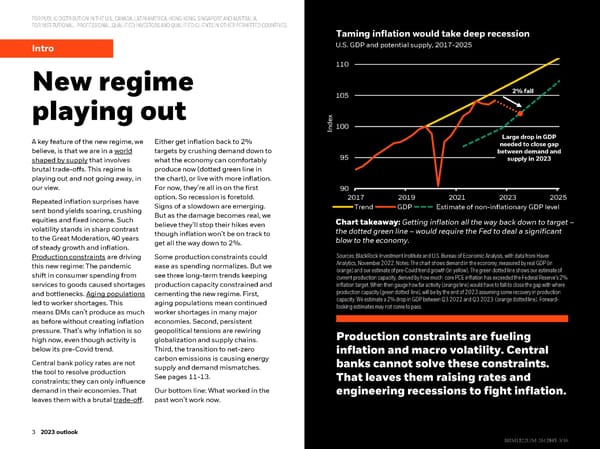
FOR PUBLIC DISTRIBUTION IN THE U.S., CANADA, LATIN AMERICA, HONGKONG, SINGAPORE AND AUSTRALIA. FOR INSTITUTIONAL, PROFESSIONAL, QUALIFIED INVESTORS AND QUALIFIED CLIENTS IN OTHER PERMITTED COUNTRIES. Taming inflation would take deep recession Intro U.S. GDP and potential supply, 2017-2025 New regime 110 105 2% fall playing out dex In100 A key feature of the new regime, we Either get inflation back to 2% Large drop in GDP needed to close gap believe, is that we are in a world targets by crushing demand down to between demand and shaped by supplythat involves what the economy can comfortably 95 supply in 2023 brutal trade-offs. This regime is produce now (dotted green line in playing out and not going away, in the chart), or live with more inflation. our view. For now, they’re all in on the first 90 Repeated inflation surprises have option. So recession is foretold. 2017 2019 2021 2023 2025 sent bond yields soaring, crushing Signs of a slowdown are emerging. Trend GDP Estimate of non-inflationary GDP level equities and fixed income. Such But as the damage becomes real, we Chart takeaway:Getting inflation all the way back down to target – volatility stands in sharp contrast believe they’ll stop their hikes even the dotted green line –would require the Fed to deal a significant to the Great Moderation, 40 years though inflation won’t be on track to blow to the economy. of steady growth and inflation. get all the way down to 2%. Production constraintsare driving Some production constraints could Sources: BlackRock Investment Institute and U.S. Bureau of Economic Analysis, with data from Haver this new regime: The pandemic ease as spending normalizes. But we Analytics, November 2022. Notes: The chart shows demand in the economy, measured by real GDP (in shift in consumer spending from see three long-term trends keeping orange) and our estimate of pre-Covid trend growth (in yellow). The green dotted line shows our estimate of current production capacity, derived by how much core PCE inflation has exceeded the Federal Reserve’s 2% services to goods caused shortages production capacity constrained and inflation target. When then gauge how far activity (orange line) would have to fall to close the gap with where and bottlenecks. Aging populations cementing the new regime. First, production capacity (green dotted line), will be by the end of 2023 assuming some recovery in production led to worker shortages. This aging populations mean continued capacity. We estimate a 2% drop in GDP between Q3 2022 and Q3 2023 (orange dotted line). Forward- means DMs can’t produce as much worker shortages in many major looking estimates may not come to pass. as before without creating inflation economies. Second, persistent pressure. That’s why inflation is so geopolitical tensions are rewiring Production constraints are fueling high now, even though activity is globalization and supply chains. below its pre-Covid trend. Third, the transition to net-zero inflation and macro volatility. Central Central bank policy rates are not carbon emissions is causing energy banks cannot solve these constraints. the tool to resolve production supply and demand mismatches. constraints; they can only influence See pages 11-13. That leaves them raising rates and demand in their economies. That Our bottom line: What worked in the engineering recessions to fight inflation. leaves them with a brutal trade-off. past won’t work now. 3 2023 outlook 3 3 2022 midyear outlook BBIIIIMM1122U/M1222U/M--26121472617935--33/16/16
 BlackRock 2023 Global Outlook Page 2 Page 4