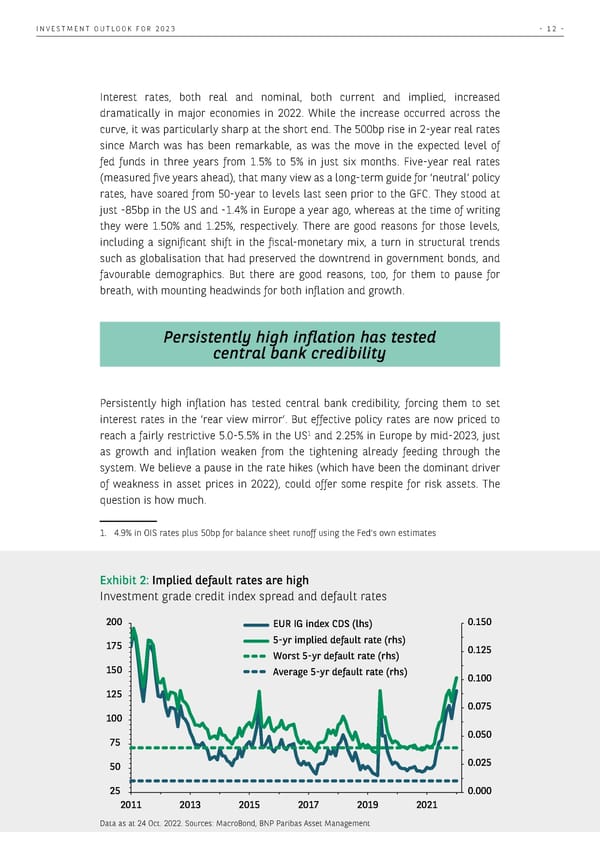
INVESTMENT OUTLOOK FOR 2023 - 12 - Interest rates, both real and nominal, both current and implied, increased dramatically in major economies in 2022. While the increase occurred across the curve, it was particularly sharp at the short end. The 500bp rise in 2-year real rates since March was has been remarkable, as was the move in the expected level of fed funds in three years from 1.5% to 5% in just six months. Five-year real rates (measured five years ahead), that many view as a long-term guide for ‘neutral’ policy rates, have soared from 50-year to levels last seen prior to the GFC. They stood at just -85bp in the US and -1.4% in Europe a year ago, whereas at the time of writing they were 1.50% and 1.25%, respectively. There are good reasons for those levels, including a significant shift in the fiscal-monetary mix, a turn in structural trends such as globalisation that had preserved the downtrend in government bonds, and favourable demographics. But there are good reasons, too, for them to pause for breath, with mounting headwinds for both inflation and growth. Persistently high inflation has tested central bank credibility Persistently high inflation has tested central bank credibility, forcing them to set interest rates in the ‘rear view mirror’. But effective policy rates are now priced to 1 reach a fairly restrictive 5.0-5.5% in the US and 2.25% in Europe by mid-2023, just as growth and inflation weaken from the tightening already feeding through the system. We believe a pause in the rate hikes (which have been the dominant driver of weakness in asset prices in 2022), could offer some respite for risk assets. The question is how much. 1. 4.9% in OIS rates plus 50bp for balance sheet runoff using the Fed’s own estimates Exhibit 2: Implied default rates are high Investment grade credit index spread and default rates 200 EUR IG index CDS (lhs) 0.150 175 5-yr imlied del re (rhs) rs 5-yr del re (rhs) 0.125 150 €er‚e 5-yr del re (rhs) 0.100 125 0.075 100 75 0.050 50 0.025 25 0.000 2011 2013 2015 2017 2019 2021 Data as at 24 Oct. 2022. Sources: MacroBond, BNP Paribas Asset Management
 BNP Paribas The Investment Outlook for 2023 Page 11 Page 13