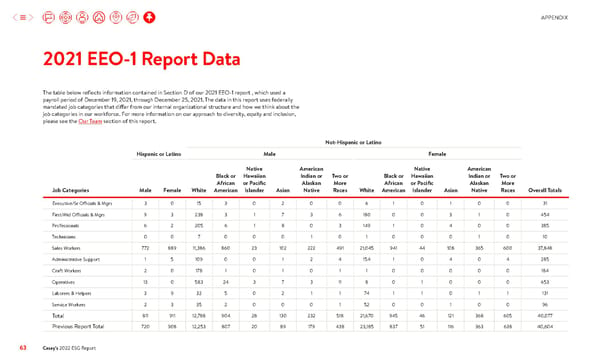
APPENDIX 2021 EEO-1 Report Data The table below reflects information contained in Section D of our 2021 EEO-1 report , which used a payroll period of December 19, 2021, through December 25, 2021. The data in this report uses federally mandated job categories that differ from our internal organizational structure and how we think about the job categories in our workforce. For more information on our approach to diversity, equity and inclusion, please see the Our Team section of this report. Not-Hispanic or Latino Hispanic or Latino Male Female Native American Native American Black or Hawaiian Indian or Two or Black or Hawaiian Indian or Two or African or Pacific Alaskan More African or Pacific Alaskan More Job Categories Male Female White American Islander Asian Native Races White American Islander Asian Native Races Overall Totals Executive/Sr Officials & Mgrs 3 0 15 3 0 2 0 0 6 1 0 1 0 0 31 First/Mid Officials & Mgrs 9 3 238 3 1 7 3 6 180 0 0 3 1 0 454 Professionals 6 2 205 6 1 8 0 3 149 1 0 4 0 0 385 Technicians 0 0 7 0 0 0 1 0 1 0 0 0 1 0 10 Sales Workers 772 889 11,386 860 23 102 222 491 21,045 941 44 108 365 600 37,848 Administrative Support 1 5 109 0 0 1 2 4 154 1 0 4 0 4 285 Craft Workers 2 0 178 1 0 1 0 1 1 0 0 0 0 0 184 Operatives 13 0 583 24 3 7 3 11 8 0 1 0 0 0 653 Laborers & Helpers 3 9 32 5 0 2 1 1 74 1 1 0 1 1 131 Service Workers 2 3 35 2 0 0 0 1 52 0 0 1 0 0 96 Total 811 911 12,788 904 28 130 232 518 21,670 945 46 121 368 605 40,077 Previous Report Total 720 908 12,253 807 20 89 179 438 23,185 837 51 116 363 638 40,604 63 Casey’s 2022 ESG Report
 Casey's ESG Report Page 62 Page 64