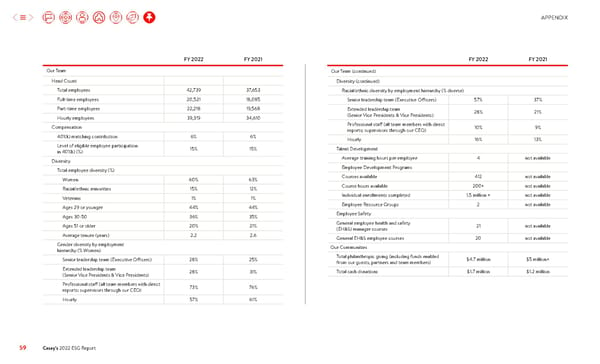
APPENDIX FY 2022 FY 2021 FY 2022 FY 2021 Our Team Our Team (continued) Head Count Diversity (continued) Total employees 42,739 37,653 Racial/ethnic diversity by employment hierarchy (% diverse) Full-time employees 20,521 18,085 Senior leadership team (Executive Officers) 57% 37% Part-time employees 22,218 19,568 Extended leadership team 28% 21% Hourly employees 39,319 34,610 (Senior Vice Presidents & Vice Presidents) Compensation Professional staff (all team members with direct 10% 9% reports; supervisors through our CEO) 401(k) matching contribution 6% 6% Hourly 16% 13% Level of eligible employee participation 15% 15% Talent Development in 401(k) (%) Diversity Average training hours per employee 4 not available Total employee diversity (%) Employee Development Programs Women 60% 63% Courses available 412 not available Racial/ethnic minorities 15% 12% Course hours available 200+ not available Veterans 1% 1% Individual enrollments completed 1.5 million + not available Ages 29 or younger 44% 44% Employee Resource Groups 2 not available Ages 30-50 36% 35% Employee Safety Ages 51 or older 20% 21% General employee health and safety 21 not available (EH&S) manager courses Average tenure (years) 2.2 2.6 General EH&S employee courses 20 not available Gender diversity by employment Our Communities hierarchy (% Women) Senior leadership team (Executive Officers) 28% 25% Total philanthropic giving (including funds enabled $4.7 million $5 million+ from our guests, partners and team members) Extended leadership team 28% 31% Total cash donations $1.7 million $1.2 million (Senior Vice Presidents & Vice Presidents) Professional staff (all team members with direct 73% 76% reports; supervisors through our CEO) Hourly 57% 61% 59 Casey’s 2022 ESG Report
 Casey's ESG Report Page 58 Page 60