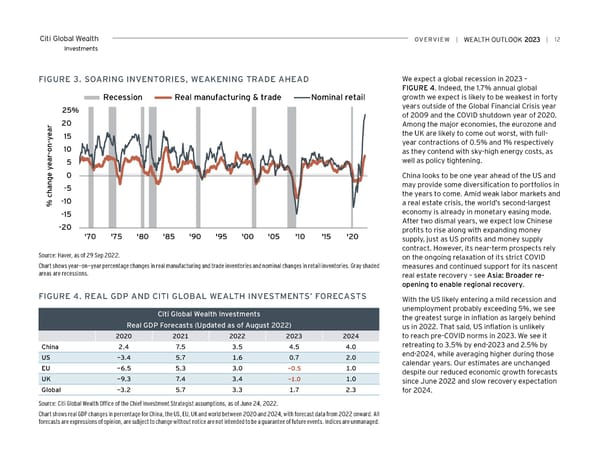
Citi Global Wealth overview | | 12 Investments FiGUre 3. SoAriNG iNveNTorieS, weAKeNiNG TrADe AHeAD We expect a global recession in 2023 – FIGURE 4. Indeed, the 1.7% annual global growth we expect is likely to be weakest in forty Recession Real manufacturing & trade Nominal retail 25% years outside of the Global Financial Crisis year of 2009 and the COVID shutdown year of 2020. 20 Among the major economies, the eurozone and 15 the UK are likely to come out worst, with full- year contractions of 0.5% and 1% respectively 10 as they contend with sky-high energy costs, as 5 well as policy tightening. 0 China looks to be one year ahead of the US and -5 may provide some diversification to portfolios in the years to come. Amid weak labor markets and % change year-on-year-10 a real estate crisis, the world’s second-largest -15 economy is already in monetary easing mode. After two dismal years, we expect low Chinese -20 profits to rise along with expanding money '70 '75 '80 '85 '90 '95 '00 '05 '10 '15 '20 supply, just as US profits and money supply contract. However, its near-term prospects rely Source: Haver, as of 29 Sep 2022. on the ongoing relaxation of its strict COVID Chart shows year-on-year percentage changes in real manufacturing and trade inventories and nominal changes in retail inventories. Gray shaded measures and continued support for its nascent areas are recessions. real estate recovery – see Asia: Broader re- opening to enable regional recovery. FiGUre 4. reAL GDP AND CiTi GLoBAL weALTH iNveSTMeNTS’ ForeCASTS With the US likely entering a mild recession and Citi Global wealth investments unemployment probably exceeding 5%, we see the greatest surge in inflation as largely behind real GDP Forecasts (Updated as of August 2022) us in 2022. That said, US inflation is unlikely 2020 2021 2022 2023 2024 to reach pre-COVID norms in 2023. We see it China 2.4 7.5 3.5 4.5 4.0 retreating to 3.5% by end-2023 and 2.5% by US -3.4 5.7 1.6 0.7 2.0 end-2024, while averaging higher during those calendar years. Our estimates are unchanged eU -6.5 5.3 3.0 -0.5 1.0 despite our reduced economic growth forecasts UK -9.3 7.4 3.4 -1.0 1.0 since June 2022 and slow recovery expectation Global -3.2 5.7 3.3 1.7 2.3 for 2024. Source: Citi Global Wealth Office of the Chief Investment Strategist assumptions, as of June 24, 2022. Chart shows real GDP changes in percentage for China, the US, EU, UK and world between 2020 and 2024, with forecast data from 2022 onward. All forecasts are expressions of opinion, are subject to change without notice are not intended to be a guarantee of future events. Indices are unmanaged.
 Citi Wealth Outlook 2023 Page 11 Page 13