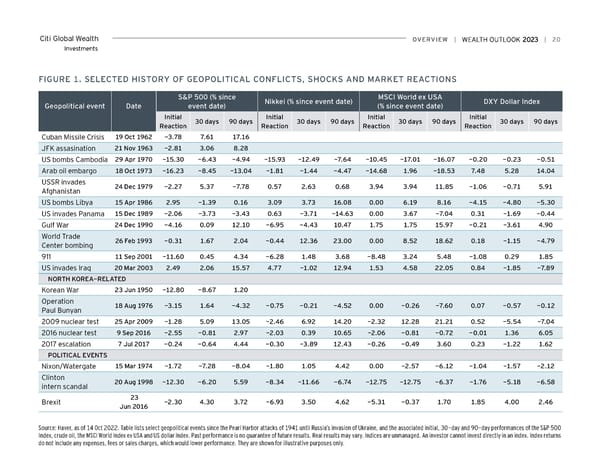
Citi Global Wealth overview | | 20 Investments FiGUre 1. SeLeCTeD HiSTorY oF GeoPoLiTiCAL CoNFLiCTS, SHoCKS AND MArKeT reACTioNS S&P 500 (% since Nikkei (% since event date) MSCi world ex USA DXY Dollar index Geopolitical event Date event date) (% since event date) initial 30 days 90 days initial 30 days 90 days initial 30 days 90 days initial 30 days 90 days reaction reaction reaction reaction Cuban Missile Crisis 19 oct 1962 -3.78 7.61 17.16 JFK assasination 21 Nov 1963 -2.81 3.06 8.28 US bombs Cambodia 29 Apr 1970 -15.30 -6.43 -4.94 -15.93 -12.49 -7.64 -10.45 -17.01 -16.07 -0.20 -0.23 -0.51 Arab oil embargo 18 oct 1973 -16.23 -8.45 -13.04 -1.81 -1.44 -4.47 -14.68 1.96 -18.53 7.48 5.28 14.04 USSR invades 24 Dec 1979 -2.27 5.37 -7.78 0.57 2.63 0.68 3.94 3.94 11.85 -1.06 -0.71 5.91 Afghanistan US bombs Libya 15 Apr 1986 2.95 -1.39 0.16 3.09 3.73 16.08 0.00 6.19 8.16 -4.15 -4.80 -5.30 US invades Panama 15 Dec 1989 -2.06 -3.73 -3.43 0.63 -3.71 -14.63 0.00 3.67 -7.04 0.31 -1.69 -0.44 Gulf War 24 Dec 1990 -4.16 0.09 12.10 -6.95 -4.43 10.47 1.75 1.75 15.97 -0.21 -3.61 4.90 World Trade 26 Feb 1993 -0.31 1.67 2.04 -0.44 12.36 23.00 0.00 8.52 18.62 0.18 -1.15 -4.79 Center bombing 911 11 Sep 2001 -11.60 0.45 4.34 -6.28 1.48 3.68 -8.48 3.24 5.48 -1.08 0.29 1.85 US invades Iraq 20 Mar 2003 2.49 2.06 15.57 4.77 -1.02 12.94 1.53 4.58 22.05 0.84 -1.85 -7.89 NorTH KoreA-reLATeD Korean War 23 Jun 1950 -12.80 -8.67 1.20 Operation 18 Aug 1976 -3.15 1.64 -4.32 -0.75 -0.21 -4.52 0.00 -0.26 -7.60 0.07 -0.57 -0.12 Paul Bunyan 2009 nuclear test 25 Apr 2009 -1.28 5.09 13.05 -2.46 6.92 14.20 -2.32 12.28 21.21 0.52 -5.54 -7.04 2016 nuclear test 9 Sep 2016 -2.55 -0.81 2.97 -2.03 0.39 10.65 -2.06 -0.81 -0.72 -0.01 1.36 6.05 2017 escalation 7 Jul 2017 -0.24 -0.64 4.44 -0.30 -3.89 12.43 -0.26 -0.49 3.60 0.23 -1.22 1.62 PoLiTiCAL eveNTS Nixon/Watergate 15 Mar 1974 -1.72 -7.28 -8.04 -1.80 1.05 4.42 0.00 -2.57 -6.12 -1.04 -1.57 -2.12 Clinton 20 Aug 1998 -12.30 -6.20 5.59 -8.34 -11.66 -6.74 -12.75 -12.75 -6.37 -1.76 -5.18 -6.58 intern scandal Brexit 23 -2.30 4.30 3.72 -6.93 3.50 4.62 -5.31 -0.37 1.70 1.85 4.00 2.46 Jun 2016 Source: Haver, as of 14 Oct 2022. Table lists select geopolitical events since the Pearl Harbor attacks of 1941 until Russia’s invasion of Ukraine, and the associated initial, 30-day and 90-day performances of the S&P 500 Index, crude oil, the MSCI World Index ex USA and US dollar Index. Past performance is no guarantee of future results. Real results may vary. Indices are unmanaged. An investor cannot invest directly in an index. Index returns do not include any expenses, fees or sales charges, which would lower performance. They are shown for illustrative purposes only.
 Citi Wealth Outlook 2023 Page 19 Page 21