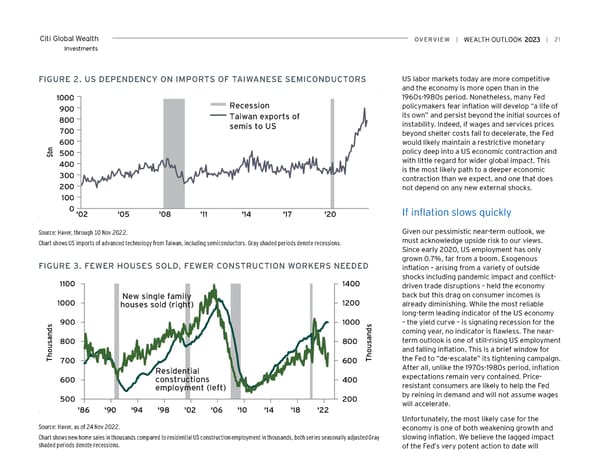
Citi Global Wealth overview | | 21 Investments FiGUre 2. US DePeNDeNCY oN iMPorTS oF TAiwANeSe SeMiCoNDUCTorS US labor markets today are more competitive and the economy is more open than in the 1000 1960s-1980s period. Nonetheless, many Fed 900 Recession policymakers fear inflation will develop “a life of 800 Taiwan exports of its own” and persist beyond the initial sources of semis to US instability. Indeed, if wages and services prices 700 beyond shelter costs fail to decelerate, the Fed n 600 would likely maintain a restrictive monetary b 500 policy deep into a US economic contraction and $ 400 with little regard for wider global impact. This 300 is the most likely path to a deeper economic contraction than we expect, and one that does 200 not depend on any new external shocks. 100 0'02 '05 '08 '11 '14 '17 '20 If inflation slows quickly Source: Haver, through 10 Nov 2022. Given our pessimistic near-term outlook, we Chart shows US imports of advanced technology from Taiwan, including semiconductors. Gray shaded periods denote recessions. must acknowledge upside risk to our views. Since early 2020, US employment has only grown 0.7%, far from a boom. Exogenous FiGUre 3. Fewer HoUSeS SoLD, Fewer CoNSTrUCTioN worKerS NeeDeD inflation – arising from a variety of outside shocks including pandemic impact and conflict- 1100 1400 driven trade disruptions – held the economy New single family back but this drag on consumer incomes is 1000 houses sold (right) 1200 already diminishing. While the most reliable long-term leading indicator of the US economy s 900 1000 s – the yield curve – is signaling recession for the d d coming year, no indicator is flawless. The near- n n a a term outlook is one of still-rising US employment s 800 800 s u u and falling inflation. This is a brief window for o o h h the Fed to “de-escalate” its tightening campaign. T 700 600 T Residential After all, unlike the 1970s-1980s period, inflation 600 constructions 400 expectations remain very contained. Price- employment (left) resistant consumers are likely to help the Fed 500 200 by reining in demand and will not assume wages will accelerate. '86 '90 '94 '98 '02 '06 '10 '14 '18 '22 Unfortunately, the most likely case for the Source: Haver, as of 24 Nov 2022. economy is one of both weakening growth and Chart shows new home sales in thousands compared to residential US construction employment in thousands, both series seasonally adjusted Gray slowing inflation. We believe the lagged impact shaded periods denote recessions. of the Fed’s very potent action to date will
 Citi Wealth Outlook 2023 Page 20 Page 22