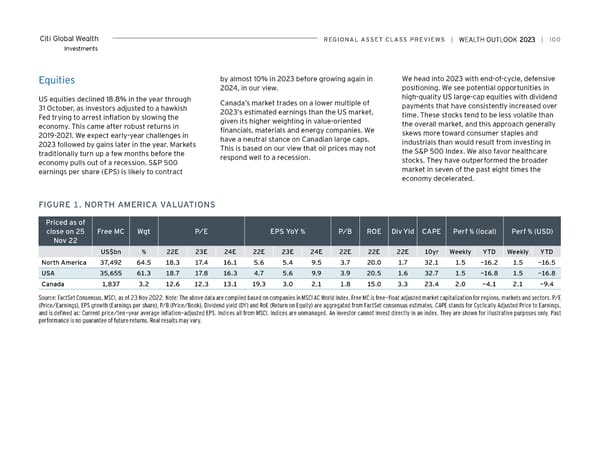
Citi Global Wealth reGioNAL ASSeT CLASS PreviewS | | 100 Investments Equities by almost 10% in 2023 before growing again in We head into 2023 with end-of-cycle, defensive 2024, in our view. positioning. We see potential opportunities in US equities declined 18.8% in the year through high-quality US large-cap equities with dividend 31 October, as investors adjusted to a hawkish Canada’s market trades on a lower multiple of payments that have consistently increased over Fed trying to arrest inflation by slowing the 2023’s estimated earnings than the US market, time. These stocks tend to be less volatile than economy. This came after robust returns in given its higher weighting in value-oriented the overall market, and this approach generally 2019-2021. We expect early-year challenges in financials, materials and energy companies. We skews more toward consumer staples and 2023 followed by gains later in the year. Markets have a neutral stance on Canadian large caps. industrials than would result from investing in traditionally turn up a few months before the This is based on our view that oil prices may not the S&P 500 Index. We also favor healthcare economy pulls out of a recession. S&P 500 respond well to a recession. stocks. They have outperformed the broader earnings per share (EPS) is likely to contract market in seven of the past eight times the economy decelerated. FiGUre 1. NorTH AMeriCA vALUATioNS Priced as of close on 25 Free MC wgt P/e ePS YoY % P/B roe Div Yld CAPe Perf % (local) Perf % (USD) Nov 22 US$bn % 22e 23e 24e 22e 23e 24e 22e 22e 22e 10yr weekly YTD weekly YTD North America 37,492 64.5 18.3 17.4 16.1 5.6 5.4 9.5 3.7 20.0 1.7 32.1 1.5 -16.2 1.5 -16.5 USA 35,655 61.3 18.7 17.8 16.3 4.7 5.6 9.9 3.9 20.5 1.6 32.7 1.5 -16.8 1.5 -16.8 Canada 1,837 3.2 12.6 12.3 13.1 19.3 3.0 2.1 1.8 15.0 3.3 23.4 2.0 -4.1 2.1 -9.4 Source: FactSet Consensus, MSCI, as of 23 Nov 2022. Note: The above data are compiled based on companies in MSCI AC World Index. Free MC is free-float adjusted market capitalization for regions, markets and sectors. P/E (Price/Earnings), EPS growth (Earnings per share), P/B (Price/Book), Dividend yield (DY) and RoE (Return on Equity) are aggregated from FactSet consensus estimates. CAPE stands for Cyclically Adjusted Price to Earnings, and is defined as: Current price/ten-year average inflation-adjusted EPS. Indices all from MSCI. Indices are unmanaged. An investor cannot invest directly in an index. They are shown for illustrative purposes only. Past performance is no guarantee of future returns. Real results may vary.
 Citi Wealth Outlook 2023 Page 99 Page 101