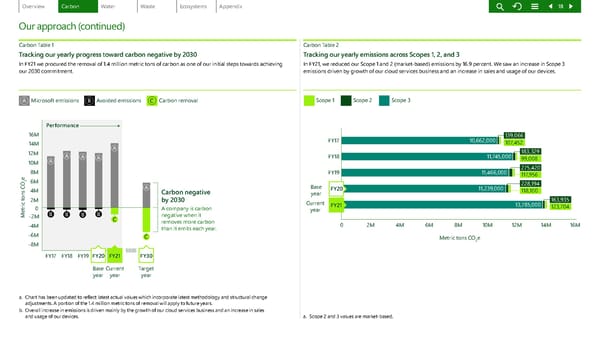
Microsoft emissions Avoided emissions Carbon removal A B C Scope 1 Scope 2 Scope 3 Performance Carbon negative by 2030 A company is carbon negative when it removes more carbon than it emits each year. 12M 10M 8M 6M 4M 2M -2M -4M -6M -8M FY17 FY18 FY19 FY30 FY21 FY20 Current year Base year Tar ge t year 0 14M 16M A A A A A A B B B B Metric tons CO 2 e C C Base year 2M 4M 6M 8M 10M 12M 14M Metric tons CO 2 e 16M 0 FY18 FY17 FY20 FY21 FY19 Current year 10,662,000 139,066 107,452 11,745,000 183,329 99,008 11,466,000 275,420 117,956 11,239,000 13,785,000 163,935 123,704 228,194 118,10 0 Carbon Table 1 Tracking our yearly progress toward carbon negative by 2030 In FY21 we procured the removal of 1.4 million metric tons of carbon as one of our initial steps towards achieving our 2030 commitment. a. Chart has been updated to reflect latest actual values which incorporate latest methodology and structural change adjustments. A portion of the 1.4 million metric tons of removal will apply to future years. b. Overall increase in emissions is driven mainly by the growth of our cloud services business and an increase in sales and usage of our devices. Carbon Table 2 Tracking our yearly emissions across Scopes 1, 2, and 3 Our approach (continued) In FY21, we reduced our Scope 1 and 2 (market-based) emissions by 16.9 percent. We saw an increase in Scope 3 emissions driven by growth of our cloud services business and an increase in sales and usage of our devices. a. Scope 2 and 3 va lues are market-based. 17 18
 Environmental Sustainability Report | Microsoft Page 17 Page 19