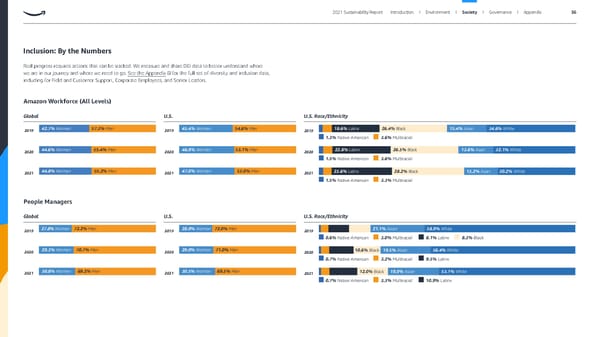
Global Inclusion: By the Numbers Real progress requires actions that can be tracked. We measure and share DEI data to better understand where we are in our journey and where we need to go. See the Appendix for the full set of diversity and inclusion data, including for Field and Customer Support, Corporate Employees, and Senior Leaders. U.S. Amazon Workforce (All Levels) U.S. Race/Ethnicity Global People Managers U.S. U.S. Race/Ethnicity 2019 2020 2021 27.8% Women 72.2% Men 29.3% Wo men 70.7% Men 30.8% Wo men 69.2% Men 2019 2020 2021 28.0% Wo men 72.0% Men 29.0% Wo men 71.0% Men 30.5% Wo men 69.5% Men 2019 2020 2021 21.1% Asian 58.9% Wh ite 3.0% Multiracial 0.6% Native American 19.5% Asian 10.6% Black 56.4% Wh ite 3.2% Multiracial 0.7% Native American 19.9% Asian 12.0% Black 53.1% Wh ite 3.3% Multiracial 8.1% Latinx 9.5% Latinx 10.9% Latinx 8.3% Black 0.7% Native American 2021 2019 2020 2021 42.7% Wo men 57.3% Men 44.6% Wo men 55.4% Men 44.8% Wo men 55.2% Men 2019 2020 2021 45.4% Wo men 54.6% Men 46.9% Wo men 53.1% Men 47.0% Wo men 53.0% Men 2019 2020 2021 18.6% Latinx 15.4% Asian 34.6% Wh ite 26.4% Black 3.6% Multiracial 1.3% Native American 22.8% Latinx 13.6% Asian 32.1% Wh ite 26.5% Black 3.6% Multiracial 1.5% Native American 23.6% Latinx 13.2% Asian 30.2% Wh ite 28.2% Black 3.3% Multiracial 1.5% Native American 2021 2021 Sustainability Report Introduction I Environment I Society I Governance I Appendix 56
 ESG Report | Amazon Page 55 Page 57