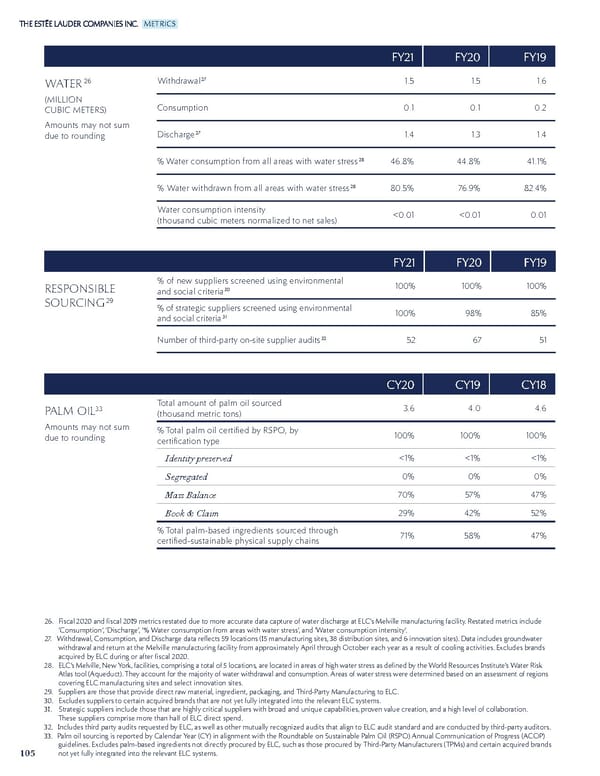
105 METRICS 26. Fiscal 2020 and fiscal 2019 metrics restated due to more accurate data capture of water discharge at ELC’s Melville manufacturing facility. Restated metrics include ‘Consumption’, ‘Discharge’, ‘% Water consumption from areas with water stress’, and ‘Water consumption intensity’. 27. Withdrawal, Consumption, and Discharge data reflects 59 locations (15 manufacturing sites, 38 distribution sites, and 6 innovation sites). Data includes groundwater withdrawal and return at the Melville manufacturing facility from approximately April through October each year as a result of cooling activities. Excludes brands acquired by ELC during or after fiscal 2020. 28. ELC’s Melville, New York, facilities, comprising a total of 5 locations, are located in areas of high water stress as defined by the World Resources Institute’s Water Risk Atlas tool (Aqueduct). They account for the majority of water withdrawal and consumption. Areas of water stress were determined based on an assessment of regions covering ELC manufacturing sites and select innovation sites. 29. Suppliers are those that provide direct raw material, ingredient, packaging, and Third-Party Manufacturing to ELC. 30. Excludes suppliers to certain acquired brands that are not yet fully integrated into the relevant ELC systems. 31. Strategic suppliers include those that are highly critical suppliers with broad and unique capabilities, proven value creation, and a high level of collaboration. These suppliers comprise more than half of ELC direct spend. 32. Includes third party audits requested by ELC, as well as other mutually recognized audits that align to ELC audit standard and are conducted by third-party auditors. 33. Palm oil sourcing is reported by Calendar Year (CY) in alignment with the Roundtable on Sustainable Palm Oil (RSPO) Annual Communication of Progress (ACOP) guidelines. Excludes palm-based ingredients not directly procured by ELC, such as those procured by Third-Party Manufacturers (TPMs) and certain acquired brands not yet fully integrated into the relevant ELC systems. FY21 FY21 FY20 FY20 FY19 FY19 WATER 26 (MILLION CUBIC METERS) Amounts may not sum due to rounding Withdrawal 27 1.5 1.5 1.6 Consumption 0.1 0.1 0.2 Discharge 27 1.4 1.3 1.4 % Water consumption from all areas with water stress 28 46.8% 44.8% 41.1% % Water withdrawn from all areas with water stress 28 80.5% 76.9% 82.4% Water consumption intensity (thousand cubic meters normalized to net sales) <0.01 <0.01 0.01 CY20 CY20 CY19 CY19 CY18 CY18 PALM OIL 33 Amounts may not sum due to rounding Total amount of palm oil sourced (thousand metric tons) 3.6 4.0 4.6 % Total palm oil certified by RSPO, by certification type 100% 100% 100% Identity preserved <1% <1% <1% Segregated 0% 0% 0% Mass Balance 70% 57% 47% Book & Claim 29% 42% 52% % Total palm-based ingredients sourced through certified-sustainable physical supply chains 71% 58% 47% FY21 FY21 FY20 FY20 FY19 FY19 RESPONSIBLE SOURCING 29 % of new suppliers screened using environmental and social criteria 30 100% 100% 100% % of strategic suppliers screened using environmental and social criteria 31 100% 98% 85% Number of third-party on-site supplier audits 32 52 67 51
 Estee Lauder Companies Sustainability Report Page 105 Page 107