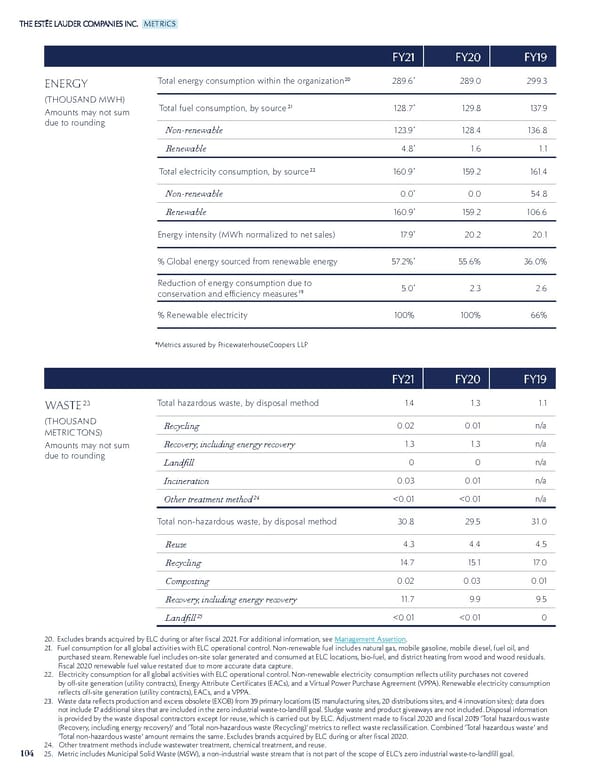
104 FY21 FY21 FY20 FY20 FY19 FY19 ENERGY (THOUSAND MWH) Amounts may not sum due to rounding Total energy consumption within the organization 20 289.6 * 289.0 299.3 Total fuel consumption, by source 21 128.7 * 129.8 1 3 7.9 Non-renewable 1 23.9 * 128.4 136.8 Renewable 4.8 * 1.6 1.1 Total electricity consumption, by source 22 160.9 * 1 59.2 161.4 Non-renewable 0.0 * 0.0 54.8 Renewable 160.9 * 1 59.2 106.6 Energy intensity (MWh normalized to net sales) 1 7.9 * 20.2 20.1 % Global energy sourced from renewable energy 57.2% * 55.6% 36.0% Reduction of energy consumption due to conservation and efficiency measures 19 5.0 * 2.3 2.6 % Renewable electricity 100% 100% 66% FY21 FY21 FY20 FY20 FY19 FY19 WASTE 23 (THOUSAND METRIC TONS) Amounts may not sum due to rounding Total hazardous waste, by disposal method 1.4 1.3 1.1 Recycling 0.02 0.01 n/a Recovery, including energy recovery 1.3 1.3 n/a Landfill 0 0 n/a Incineration 0.03 0.01 n/a Other treatment method 24 <0.01 <0.01 n/a Total non-hazardous waste, by disposal method 30.8 29.5 31.0 Reuse 4.3 4.4 4.5 Recycling 14.7 15.1 1 7. 0 Composting 0.02 0.03 0.01 Recovery, including energy recovery 11.7 9.9 9.5 Landfill 25 <0.01 <0.01 0 20. Excludes brands acquired by ELC during or after fiscal 2021. For additional information, see Management Assertion. 21. Fuel consumption for all global activities with ELC operational control. Non-renewable fuel includes natural gas, mobile gasoline, mobile diesel, fuel oil, and purchased steam. Renewable fuel includes on-site solar generated and consumed at ELC locations, bio-fuel, and district heating from wood and wood residuals. Fiscal 2020 renewable fuel value restated due to more accurate data capture. 22. Electricity consumption for all global activities with ELC operational control. Non-renewable electricity consumption reflects utility purchases not covered by off-site generation (utility contracts), Energy Attribute Certificates (EACs), and a Virtual Power Purchase Agreement (VPPA). Renewable electricity consumption reflects off-site generation (utility contracts), EACs, and a VPPA. 23. Waste data reflects production and excess obsolete (EXOB) from 39 primary locations (15 manufacturing sites, 20 distributions sites, and 4 innovation sites); data does not include 17 additional sites that are included in the zero industrial waste-to-landfill goal. Sludge waste and product giveaways are not included. Disposal information is provided by the waste disposal contractors except for reuse, which is carried out by ELC. Adjustment made to fiscal 2020 and fiscal 2019 ‘Total hazardous waste (Recovery, including energy recovery)’ and ‘Total non-hazardous waste (Recycling)’ metrics to reflect waste reclassification. Combined ‘Total hazardous waste’ and ‘Total non-hazardous waste’ amount remains the same. Excludes brands acquired by ELC during or after fiscal 2020. 24. Other treatment methods include wastewater treatment, chemical treatment, and reuse. 25. Metric includes Municipal Solid Waste (MSW), a non-industrial waste stream that is not part of the scope of ELC’s zero industrial waste-to-landfill goal. *Metrics assured by PricewaterhouseCoopers LLP METRICS
 Estee Lauder Companies Sustainability Report Page 104 Page 106