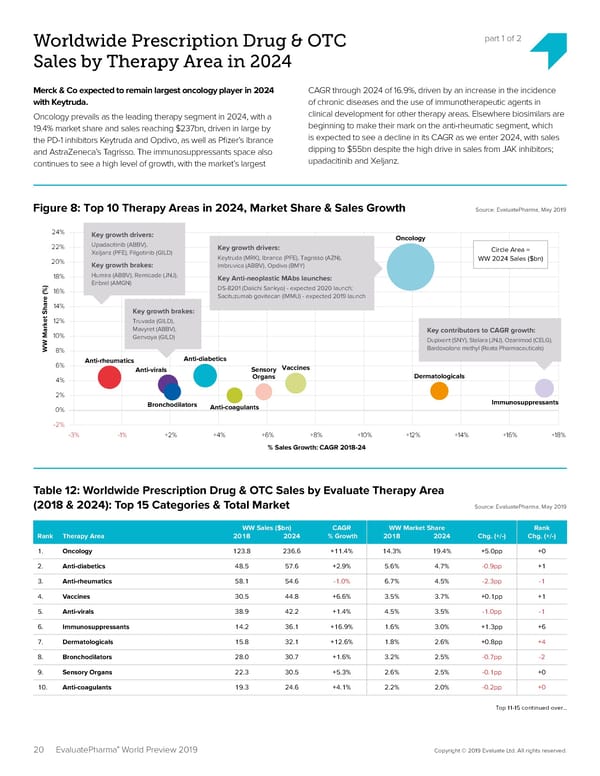
Worldwide Prescription Drug & OTC part 1 of 2 Sales by Therapy Area in 2024 Merck & Co expected to remain largest oncology player in 2024 CAGR through 2024 of 16.9%, driven by an increase in the incidence with Keytruda. of chronic diseases and the use of immunotherapeutic agents in Oncology prevails as the leading therapy segment in 2024, with a clinical development for other therapy areas. Elsewhere biosimilars are 19.4% market share and sales reaching $237bn, driven in large by beginning to make their mark on the anti-rheumatic segment, which the PD-1 inhibitors Keytruda and Opdivo, as well as P昀椀zer’s Ibrance is expected to see a decline in its CAGR as we enter 2024, with sales and AstraZeneca’s Tagrisso. The immunosuppressants space also dipping to $55bn despite the high drive in sales from JAK inhibitors; continues to see a high level of growth, with the market’s largest upadacitinib and Xeljanz. Figure 8: Top 10 Therapy Areas in 2024, Market Share & Sales Growth Source: EvaluatePharma, May 2019 24% Key growth drivers: Oncology 22% Upadacitinib (ABBV), Key growth drivers: Circle Area = Xeljanz (PFE), Filgotinib (GILD) Keytruda (MRK), Ibrance (PFE), Tagrisso (AZN), WW 2024 Sales ($bn) 20% Key growth brakes: Imbruvica (ABBV), Opdivo (BMY) 18% Humira (ABBV), Remicade (JNJ), Key Anti-neoplastic MAbs launches: Enbrel (AMGN) DS-8201 (Daiichi Sankyo) - expected 2020 launch; 16% Sacituzumab govitecan (IMMU) - expected 2019 launch 14% Key growth brakes: 12% Truvada (GILD), Mavyret (ABBV), Key contributors to CAGR growth: 10% Genvoya (GILD) Dupixent (SNY), Stelara (JNJ), Ozanimod (CELG), WW Market Share (%)8% Bardoxolone methyl (Reata Pharmaceuticals) Anti-rheumatics Anti-diabetics 6% Anti-virals Sensory Vaccines 4% Organs Dermatologicals 2% Bronchodilators Anti-coagulants Immunosuppressants 0% -2% -3% -1% +2% +4% +6% +8% +10% +12% +14% +16% +18% % Sales Growth: CAGR 2018-24 Table 12: Worldwide Prescription Drug & OTC Sales by Evaluate Therapy Area (2018 & 2024): Top 15 Categories & Total Market Source: EvaluatePharma, May 2019 WW Sales ($bn) CAGR WW Market Share Rank Rank Therapy Area 2018 2024 % Growth 2018 2024 Chg. (+/-) Chg. (+/-) 1. Oncology 123.8 236.6 +11.4% 14.3% 19.4% +5.0pp +0 2. Anti-diabetics 48.5 57.6 +2.9% 5.6% 4.7% -0.9pp +1 3. Anti-rheumatics 58.1 54.6 -1.0% 6.7% 4.5% -2.3pp -1 4. Vaccines 30.5 44.8 +6.6% 3.5% 3.7% +0.1pp +1 5. Anti-virals 38.9 42.2 +1.4% 4.5% 3.5% -1.0pp -1 6. Immunosuppressants 14.2 36.1 +16.9% 1.6% 3.0% +1.3pp +6 7. Dermatologicals 15.8 32.1 +12.6% 1.8% 2.6% +0.8pp +4 8. Bronchodilators 28.0 30.7 +1.6% 3.2% 2.5% -0.7pp -2 9. Sensory Organs 22.3 30.5 +5.3% 2.6% 2.5% -0.1pp +0 10. Anti-coagulants 19.3 24.6 +4.1% 2.2% 2.0% -0.2pp +0 Top 11-15 continued over… ® 20 EvaluatePharma World Preview 2019 Copyright © 2019 Evaluate Ltd. All rights reserved.
 EvaluatePharma 2024 Page 19 Page 21