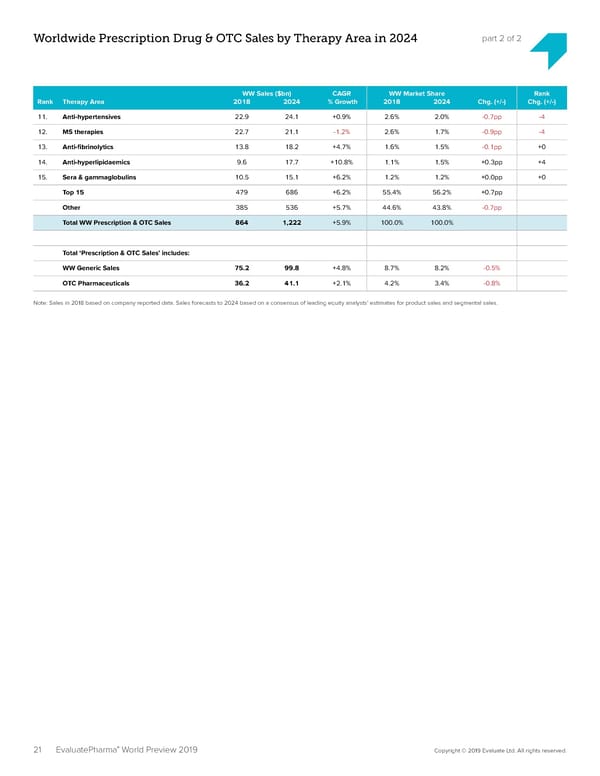
Worldwide Prescription Drug & OTC Sales by Therapy Area in 2024 part 2 of 2 WW Sales ($bn) CAGR WW Market Share Rank Rank Therapy Area 2018 2024 % Growth 2018 2024 Chg. (+/-) Chg. (+/-) 11. Anti-hypertensives 22.9 24.1 +0.9% 2.6% 2.0% -0.7pp -4 12. MS therapies 22.7 21.1 -1.2% 2.6% 1.7% -0.9pp -4 13. Anti-昀椀brinolytics 13.8 18.2 +4.7% 1.6% 1.5% -0.1pp +0 14. Anti-hyperlipidaemics 9.6 17.7 +10.8% 1.1% 1.5% +0.3pp +4 15. Sera & gammaglobulins 10.5 15.1 +6.2% 1.2% 1.2% +0.0pp +0 Top 15 479 686 +6.2% 55.4% 56.2% +0.7pp Other 385 536 +5.7% 44.6% 43.8% -0.7pp Total WW Prescription & OTC Sales 864 1,222 +5.9% 100.0% 100.0% Total ‘Prescription & OTC Sales’ includes: WW Generic Sales 75.2 99.8 +4.8% 8.7% 8.2% -0.5% OTC Pharmaceuticals 36.2 41.1 +2.1% 4.2% 3.4% -0.8% Note: Sales in 2018 based on company reported data. Sales forecasts to 2024 based on a consensus of leading equity analysts’ estimates for product sales and segmental sales. ® 21 EvaluatePharma World Preview 2019 Copyright © 2019 Evaluate Ltd. All rights reserved.
 EvaluatePharma 2024 Page 20 Page 22