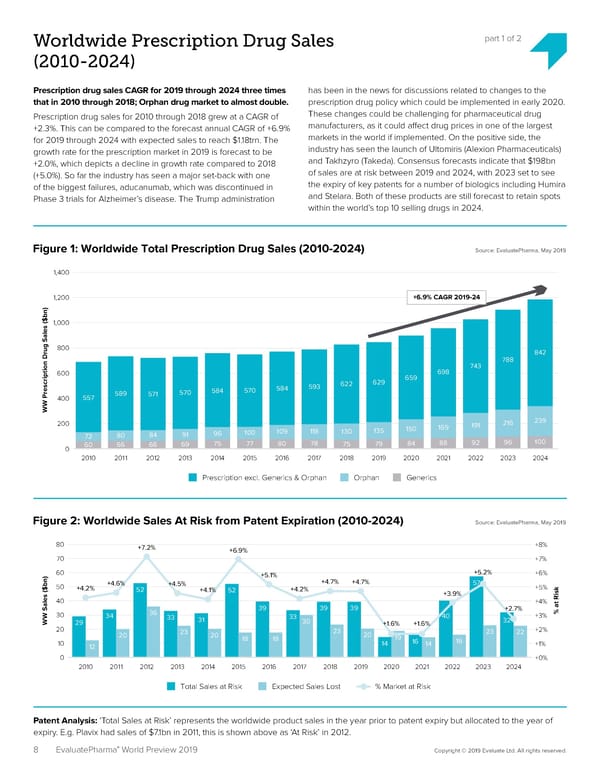
Worldwide Prescription Drug Sales part 1 of 2 (2010-2024) Prescription drug sales CAGR for 2019 through 2024 three times has been in the news for discussions related to changes to the that in 2010 through 2018; Orphan drug market to almost double. prescription drug policy which could be implemented in early 2020. Prescription drug sales for 2010 through 2018 grew at a CAGR of These changes could be challenging for pharmaceutical drug +2.3%. This can be compared to the forecast annual CAGR of +6.9% manufacturers, as it could a昀昀ect drug prices in one of the largest for 2019 through 2024 with expected sales to reach $1.18trn. The markets in the world if implemented. On the positive side, the growth rate for the prescription market in 2019 is forecast to be industry has seen the launch of Ultomiris (Alexion Pharmaceuticals) +2.0%, which depicts a decline in growth rate compared to 2018 and Takhzyro (Takeda). Consensus forecasts indicate that $198bn (+5.0%). So far the industry has seen a major set-back with one of sales are at risk between 2019 and 2024, with 2023 set to see of the biggest failures, aducanumab, which was discontinued in the expiry of key patents for a number of biologics including Humira Phase 3 trials for Alzheimer’s disease. The Trump administration and Stelara. Both of these products are still forecast to retain spots within the world’s top 10 selling drugs in 2024. Figure 1: Worldwide Total Prescription Drug Sales (2010-2024) Source: EvaluatePharma, May 2019 1,400 1,200 +6.9% CAGR 2019-24 1,000 800 842 788 698 743 600 659 593 622 629 589 571 570 584 570 584 400 557 WW Prescription Drug Sales ($bn) 200 191 216 239 96 100 109 118 130 135 150 169 72 80 84 91 60 66 66 69 75 77 80 78 75 79 84 88 92 96 100 0 2010 2011 2012 2013 2014 2015 2016 2017 2018 2019 2020 2021 2022 2023 2024 Prescription excl. Generics & Orphan Orphan Generics Figure 2: Worldwide Sales At Risk from Patent Expiration (2010-2024) Source: EvaluatePharma, May 2019 80 +7.2% +6.9% +8% 70 +7% 60 +5.1% +5.2% +6% 50 +4.6% +4.5% +4.7% +4.7% 57 +5% +4.2% 52 +4.1% 52 +4.2% +3.9% 40 +4% 36 39 39 39 +2.7% % at Risk 30 34 33 31 33 40 32 +3% WW Sales ($bn)29 30 +1.6% +1.6% 20 23 20 23 20 23 22 +2% 20 18 18 19 16 16 10 12 14 14 +1% 0 +0% 2010 2011 2012 2013 2014 2015 2016 2017 2018 2019 2020 2021 2022 2023 2024 Total Sales at Risk Expected Sales Lost % Market at Risk Patent Analysis: ‘Total Sales at Risk’ represents the worldwide product sales in the year prior to patent expiry but allocated to the year of expiry. E.g. Plavix had sales of $7.1bn in 2011, this is shown above as ‘At Risk’ in 2012. ® 8 EvaluatePharma World Preview 2019 Copyright © 2019 Evaluate Ltd. All rights reserved.
 EvaluatePharma 2024 Page 7 Page 9