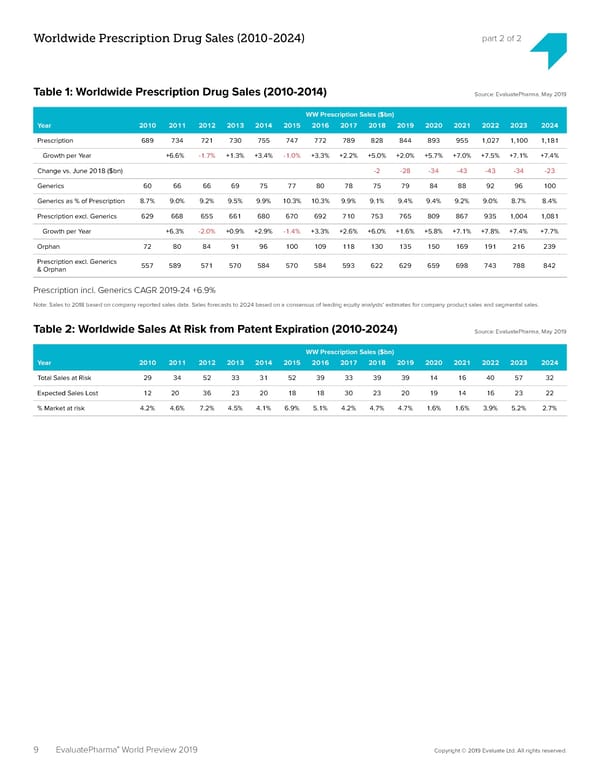
Worldwide Prescription Drug Sales (2010-2024) part 2 of 2 Table 1: Worldwide Prescription Drug Sales (2010-2014) Source: EvaluatePharma, May 2019 WW Prescription Sales ($bn) Year 2010 2011 2012 2013 2014 2015 2016 2017 2018 2019 2020 2021 2022 2023 2024 Prescription 689 734 721 730 755 747 772 789 828 844 893 955 1,027 1,100 1,181 Growth per Year +6.6% -1.7% +1.3% +3.4% -1.0% +3.3% +2.2% +5.0% +2.0% +5.7% +7.0% +7.5% +7.1% +7.4% Change vs. June 2018 ($bn) -2 -28 -34 -43 -43 -34 -23 Generics 60 66 66 69 75 77 80 78 75 79 84 88 92 96 100 Generics as % of Prescription 8.7% 9.0% 9.2% 9.5% 9.9% 10.3% 10.3% 9.9% 9.1% 9.4% 9.4% 9.2% 9.0% 8.7% 8.4% Prescription excl. Generics 629 668 655 661 680 670 692 710 753 765 809 867 935 1,004 1,081 Growth per Year +6.3% -2.0% +0.9% +2.9% -1.4% +3.3% +2.6% +6.0% +1.6% +5.8% +7.1% +7.8% +7.4% +7.7% Orphan 72 80 84 91 96 100 109 118 130 135 150 169 191 216 239 Prescription excl. Generics 557 589 571 570 584 570 584 593 622 629 659 698 743 788 842 & Orphan Prescription incl. Generics CAGR 2019-24 +6.9% Note: Sales to 2018 based on company reported sales data. Sales forecasts to 2024 based on a consensus of leading equity analysts’ estimates for company product sales and segmental sales. Table 2: Worldwide Sales At Risk from Patent Expiration (2010-2024) Source: EvaluatePharma, May 2019 WW Prescription Sales ($bn) Year 2010 2011 2012 2013 2014 2015 2016 2017 2018 2019 2020 2021 2022 2023 2024 Total Sales at Risk 29 34 52 33 31 52 39 33 39 39 14 16 40 57 32 Expected Sales Lost 12 20 36 23 20 18 18 30 23 20 19 14 16 23 22 % Market at risk 4.2% 4.6% 7.2% 4.5% 4.1% 6.9% 5.1% 4.2% 4.7% 4.7% 1.6% 1.6% 3.9% 5.2% 2.7% 9 ® World Preview 2019 Copyright © 2019 Evaluate Ltd. All rights reserved. EvaluatePharma
 EvaluatePharma 2024 Page 8 Page 10