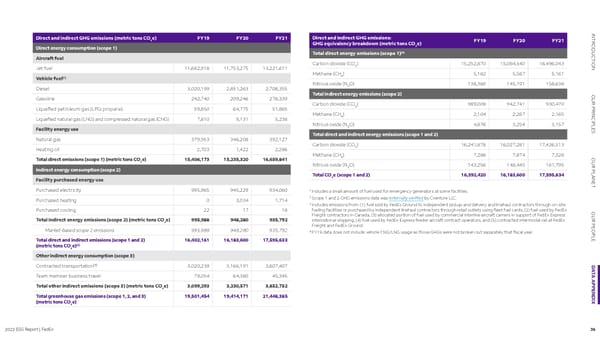
2022 ESG Report | FedEx 36 DATA APPENDIX INTRODUCTION OUR PRINCIPLES OUR PLANET OUR PEOPLE Direct and indirect GHG emissions (metric tons CO 2 e) FY19 FY20 FY21 Direct energy consumption (scope 1) Aircraft fuel Jet fuel 11,692,918 11,753,275 13,221,611 Vehicle fuel [1] Diesel 3,020,199 2,851,263 2,708,355 Gasoline 242,740 209,246 278,339 Liquefied petroleum gas (LPG: propane) 59,850 64,775 51,885 Liquefied natural gas (LNG) and compressed natural gas (CNG) 7,810 9,131 5,238 Facility energy use Natural gas 379,953 346,208 392,127 Heating oil 2,703 1,422 2,286 Total direct emissions (scope 1) (metric tons CO 2 e) 15,406,173 15,235,320 16,659,841 Indirect energy consumption (scope 2) Facility purchased energy use Purchased electricity 995,965 945,229 934,060 Purchased heating 0 3,034 1,714 Purchased cooling 22 17 18 Total indirect energy emissions (scope 2) (metric tons CO 2 e) 995,988 948,280 935,792 Market-based scope 2 emissions 995,988 948,280 935,792 Total direct and indirect emissions (scope 1 and 2) (metric tons CO 2 e) [2] 16,402,161 16,183,600 17,595,633 Other indirect energy consumption (scope 3) Contracted transportation [3] 3,020,239 3,166,191 3,807,407 Team member business travel 79,054 64,380 45,345 Total other indirect emissions (scope 3) (metric tons CO 2 e) 3,099,293 3,230,571 3,852,752 Total greenhouse gas emissions (scope 1, 2, and 3) (metric tons CO 2 e) 19,501,454 19,414,171 21,448,385 1 Includes a small amount of fuel used for emergency generators at some facilities. 2 Scope 1 and 2 GHG emissions data was externally verified by Cventure LLC. 3 Includes emissions from: (1) fuel sold by FedEx Ground to independent pickup and delivery and linehaul contractors through on-site fueling facilities or purchased by independent linehaul contractors through retail outlets using fleet fuel cards, (2) fuel used by FedEx Freight contractors in Canada, (3) allocated portion of fuel used by commercial interline aircraft carriers in support of FedEx Express international shipping, (4) fuel used by FedEx Express feeder aircraft contract operators, and (5) contracted intermodal rail at FedEx Freight and FedEx Ground. 4 FY19 data does not include vehicle CNG/LNG usage as those GHGs were not broken out separately that fiscal year. Direct and indirect GHG emissions: GHG equivalency breakdown (metric tons CO 2 e) FY19 FY20 FY21 Total direct energy emissions (scope 1) [4] Carbon dioxide (CO 2 ) 15,252,870 15,084,540 16,496,043 Methane (CH 4 ) 5,182 5,587 5,161 Nitrous oxide (N 2 O) 138,380 145,191 158,638 Total indirect energy emissions (scope 2) Carbon dioxide (CO 2 ) 989,008 942,741 930,470 Methane (CH 4 ) 2,104 2,287 2,165 Nitrous oxide (N 2 O) 4,876 3,254 3,157 Total direct and indirect energy emissions (scope 1 and 2) Carbon dioxide (CO 2 ) 16,241,878 16,027,281 17,426,513 Methane (CH 4 ) 7,286 7,874 7,326 Nitrous oxide (N 2 O) 143,256 148,445 161,795 Total CO 2 e (scope 1 and 2) 16,392,420 16,183,600 17,595,634
 FedEx ESG Report Page 35 Page 37