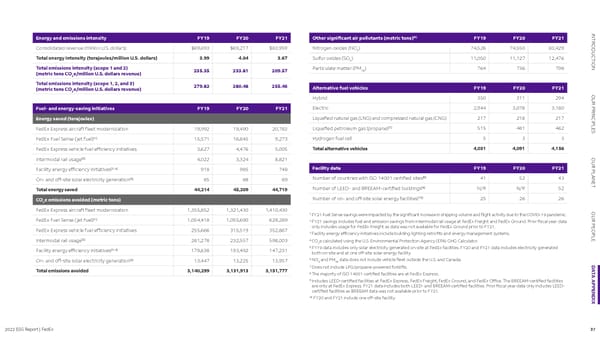
2022 ESG Report | FedEx 37 DATA APPENDIX INTRODUCTION OUR PRINCIPLES OUR PLANET OUR PEOPLE Energy and emissions intensity FY19 FY20 FY21 Consolidated revenue (million U.S. dollars) $69,693 $69,217 $83,959 Total energy intensity (terajoules/million U.S. dollars) 3.99 4.04 3.67 Total emissions intensity (scope 1 and 2) (metric tons CO 2 e/million U.S. dollars revenue) 235.35 233.81 209.57 Total emissions intensity (scope 1, 2, and 3) (metric tons CO 2 e/million U.S. dollars revenue) 279.82 280.48 255.46 Other significant air pollutants (metric tons) [6] FY19 FY20 FY21 Nitrogen oxides (NO X ) 74,526 74,550 83,429 Sulfur oxides (SO X ) 11,050 11,127 12,476 Particulate matter (PM 10 ) 764 736 798 1 FY21 Fuel Sense savings were impacted by the significant increase in shipping volume and flight activity due to the COVID-19 pandemic. 2 FY21 savings includes fuel and emission savings from intermodal rail usage at FedEx Freight and FedEx Ground. Prior fiscal year data only includes usage for FedEx Freight as data was not available for FedEx Ground prior to FY21. 3 Facility energy efficiency initiatives include building lighting retrofits and energy management systems. 4 CO 2 e calculated using the U.S. Environmental Protection Agency (EPA) GHG Calculator. 5 FY19 data includes only solar electricity generated on-site at FedEx facilities. FY20 and FY21 data includes electricity generated both on-site and at one off-site solar energy facility. 6 NO X and PM 10 data does not include vehicle fleet outside the U.S. and Canada. 7 Does not include LPG/propane-powered forklifts. 8 The majority of ISO 14001 certified facilities are at FedEx Express. 9 Includes LEED-certified facilities at FedEx Express, FedEx Freight, FedEx Ground, and FedEx Office. The BREEAM-certified facilities are only at FedEx Express. FY21 data includes both LEED- and BREEAM-certified facilities. Prior fiscal year data only includes LEED- certified facilities as BREEAM data was not available prior to FY21. 10 FY20 and FY21 include one off-site facility. Fuel- and energy-saving initiatives FY19 FY20 FY21 Energy saved (terajoules) FedEx Express aircraft fleet modernization 19,992 19,490 20,783 FedEx Fuel Sense (jet fuel) [1] 15,571 16,845 9,273 FedEx Express vehicle fuel efficiency initiatives 3,627 4,476 5,005 Intermodal rail usage [2] 4,022 3,324 8,821 Facility energy efficiency initiatives [3, 4] 918 985 748 On- and off-site solar electricity generation [5] 85 88 89 Total energy saved 44,214 45,209 44,719 CO 2 e emissions avoided (metric tons) FedEx Express aircraft fleet modernization 1,355,852 1,321,430 1,410,430 FedEx Fuel Sense (jet fuel) [1] 1,054,418 1,055,690 629,289 FedEx Express vehicle fuel efficiency initiatives 255,666 315,519 352,867 Intermodal rail usage [2] 281,278 232,557 598,003 Facility energy efficiency initiatives [3, 4] 179,638 193,492 147,231 On- and off-site solar electricity generation [5] 13,447 13,225 13,957 Total emissions avoided 3,140,299 3,131,913 3,151,777 Alternative fuel vehicles FY19 FY20 FY21 Hybrid 350 311 294 Electric 2,944 3,078 3,180 Liquefied natural gas (LNG) and compressed natural gas (CNG) 217 218 217 Liquefied petroleum gas (propane) [7] 515 481 462 Hydrogen fuel cell 5 3 3 Total alternative vehicles 4,031 4,091 4,156 Facility data FY19 FY20 FY21 Number of countries with ISO 14001 certified sites [8] 41 52 43 Number of LEED- and BREEAM-certified buildings [9] N/R N/R 52 Number of on- and off-site solar energy facilities [10] 25 26 26
 FedEx ESG Report Page 36 Page 38