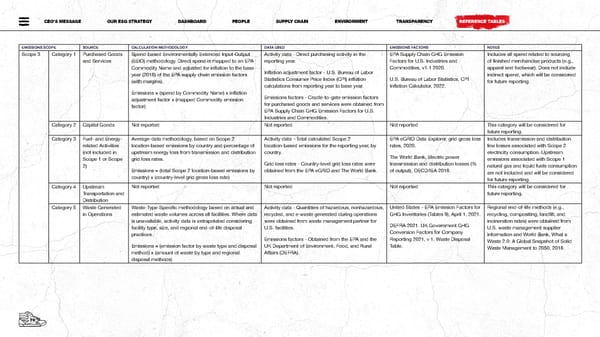
CEO’S MESSAGE OUR ESG STRATEGY DASHBOARD PEOPLE SUPPLY CHAIN ENVIRONMENT TRANSPARENCY REFERENCE TABLES EMISSIONS SCOPE SOURCE CALCULATION METHODOLOGY DATA USED EMISSIONS FACTORS NOTES Scope 3 Category 1 Purchased Goods Spend-based Environmentally Extended Input-Output Activity data - Direct purchasing activity in the EPA Supply Chain GHG Emission Includes all spend related to sourcing and Services (EEIO) methodology. Direct spend is mapped to an EPA reporting year. Factors for U.S. Industries and of finished merchandise products (e.g., Commodity Name and adjusted for inflation to the base Commodities, v1.1 2020. apparel and footwear). Does not include year (2018) of the EPA supply chain emission factors Inflation adjustment factor - U.S. Bureau of Labor indirect spend, which will be considered (with margins). Statistics Consumer Price Index (CPI) inflation U.S. Bureau of Labor Statistics, CPI for future reporting. calculations from reporting year to base year. Inflation Calculator, 2022. Emissions = (spend by Commodity Name) x inflation adjustment factor x (mapped Commodity emission Emissions factors - Cradle-to-gate emission factors factor) for purchased goods and services were obtained from EPA Supply Chain GHG Emission Factors for U.S. Industries and Commodities. Category 2 Capital Goods Not reported Not reported Not reported This category will be considered for future reporting. Category 3 Fuel- and Energy- Average-data methodology, based on Scope 2 Activity data - Total calculated Scope 2 EPA eGRID Data Explorer, grid gross loss Includes transmission and distribution related Activities location-based emissions by country and percentage of location-based emissions for the reporting year, by rates, 2020. line losses associated with Scope 2 (not included in upstream energy loss from transmission and distribution country. electricity consumption. Upstream Scope 1 or Scope grid loss rates. The World Bank, Electric power emissions associated with Scope 1 2) Grid loss rates - Country-level grid loss rates were transmission and distribution losses (% natural gas and liquid fuels consumption Emissions = (total Scope 2 location-based emissions by obtained from the EPA eGRID and The World Bank. of output), OECD/IEA 2018. are not included and will be considered country) x (country-level grid gross loss rate) for future reporting. Category 4 Upstream Not reported Not reported Not reported This category will be considered for Transportation and future reporting. Distribution Category 5 Waste Generated Waste-Type-Specific methodology based on actual and Activity data - Quantities of hazardous, nonhazardous, United States - EPA Emission Factors for Regional end-of-life methods (e.g., in Operations estimated waste volumes across all facilities. Where data recycled, and e-waste generated during operations GHG Inventories (Tables 9), April 1, 2021. recycling, compositing, landfill, and is unavailable, activity data is extrapolated considering were obtained from waste management partner for incineration rates) were obtained from facility type, size, and regional end-of-life disposal U.S. facilities. DEFRA 2021. UK Government GHG U.S. waste management supplier practices. Conversion Factors for Company information and World Bank, What a Emissions factors - Obtained from the EPA and the Reporting 2021, v 1. Waste Disposal Waste 2.0: A Global Snapshot of Solid Emissions = (emission factor by waste type and disposal UK Department of Environment, Food, and Rural Table. Waste Management to 2050, 2018. method) x (amount of waste by type and regional Affairs (DEFRA). disposal methods) 7070
 Footlocker Impact Report Page 71 Page 73