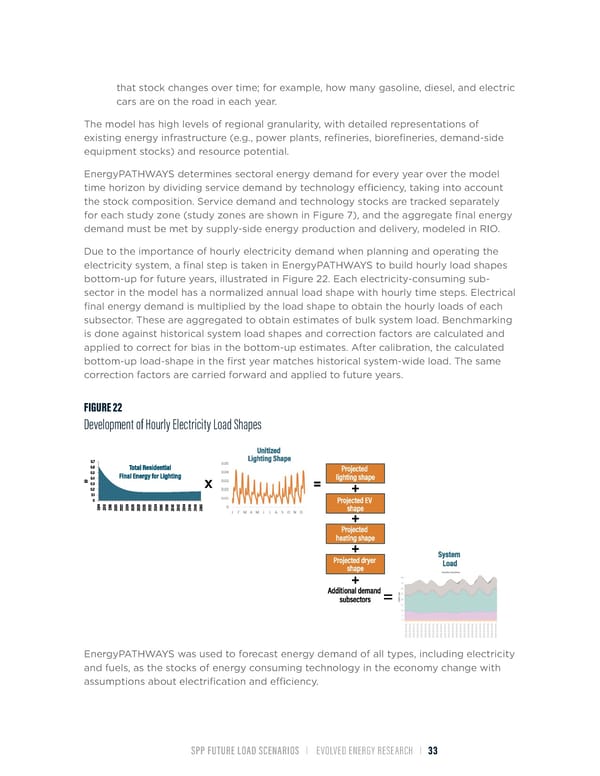
that stock changes over time; for example, how many gasoline, diesel, and electric cars are on the road in each year. The model has high levels of regional granularity, with detailed representations of existing energy infrastructure (e.g., power plants, refineries, biorefineries, demand-side equipment stocks) and resource potential. EnergyPATHWAYS determines sectoral energy demand for every year over the model time horizon by dividing service demand by technology efÏciency, taking into account the stock composition. Service demand and technology stocks are tracked separately for each study zone (study zones are shown in Figure 7), and the aggregate final energy demand must be met by supply-side energy production and delivery, modeled in RIO. Due to the importance of hourly electricity demand when planning and operating the electricity system, a final step is taken in EnergyPATHWAYS to build hourly load shapes bottom-up for future years, illustrated in Figure 22. Each electricity-consuming sub- sector in the model has a normalized annual load shape with hourly time steps. Electrical final energy demand is multiplied by the load shape to obtain the hourly loads of each subsector. These are aggregated to obtain estimates of bulk system load. Benchmarking is done against historical system load shapes and correction factors are calculated and applied to correct for bias in the bottom-up estimates. After calibration, the calculated bottom-up load-shape in the first year matches historical system-wide load. The same correction factors are carried forward and applied to future years. FIGURE 22 Development of Hourly Electricity Load Shapes EnergyPATHWAYS was used to forecast energy demand of all types, including electricity and fuels, as the stocks of energy consuming technology in the economy change with assumptions about electrification and efÏciency. SPP FUTURE LOAD SCENARIOS | EVOLVED ENERGY RESEARCH | 33
 Future Load Scenarios for Southwest Power Pool Page 34 Page 36