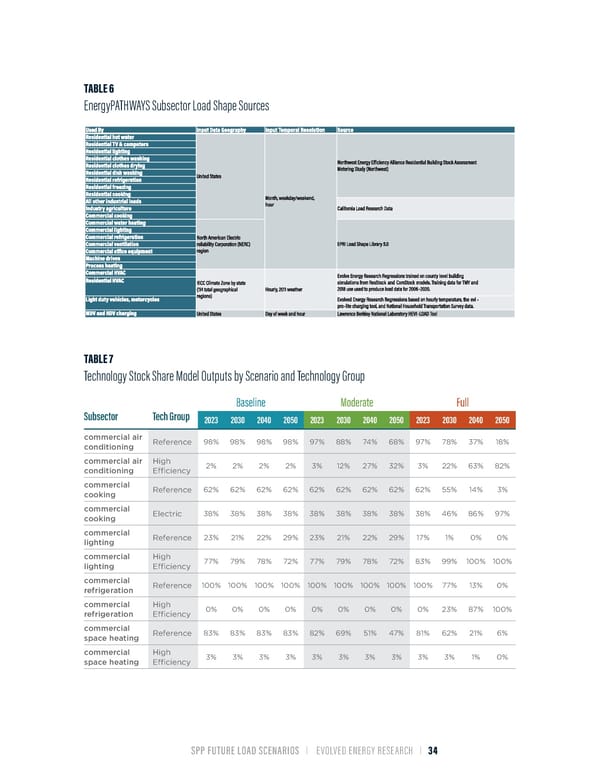
TABLE 6 EnergyPATHWAYS Subsector Load Shape Sources TABLE 7 Technology Stock Share Model Outputs by Scenario and Technology Group Baseline Moderate Full Subsector Tech Group 2023 2030 2040 2050 2023 2030 2040 2050 2023 2030 2040 2050 commercial air Reference 98% 98% 98% 98% 97% 88% 74% 68% 97% 78% 37% 18% conditioning commercial air High 2% 2% 2% 2% 3% 12% 27% 32% 3% 22% 63% 82% conditioning EfÏciency commercial Reference 62% 62% 62% 62% 62% 62% 62% 62% 62% 55% 14% 3% cooking commercial Electric 38% 38% 38% 38% 38% 38% 38% 38% 38% 46% 86% 97% cooking commercial Reference 23% 21% 22% 29% 23% 21% 22% 29% 17% 1% 0% 0% lighting commercial High 77% 79% 78% 72% 77% 79% 78% 72% 83% 99% 100% 100% lighting EfÏciency commercial Reference 100% 100% 100% 100% 100% 100% 100% 100% 100% 77% 13% 0% refrigeration commercial High 0% 0% 0% 0% 0% 0% 0% 0% 0% 23% 87% 100% refrigeration EfÏciency commercial Reference 83% 83% 83% 83% 82% 69% 51% 47% 81% 62% 21% 6% space heating commercial High 3% 3% 3% 3% 3% 3% 3% 3% 3% 3% 1% 0% space heating EfÏciency SPP FUTURE LOAD SCENARIOS | EVOLVED ENERGY RESEARCH | 34
 Future Load Scenarios for Southwest Power Pool Page 35 Page 37