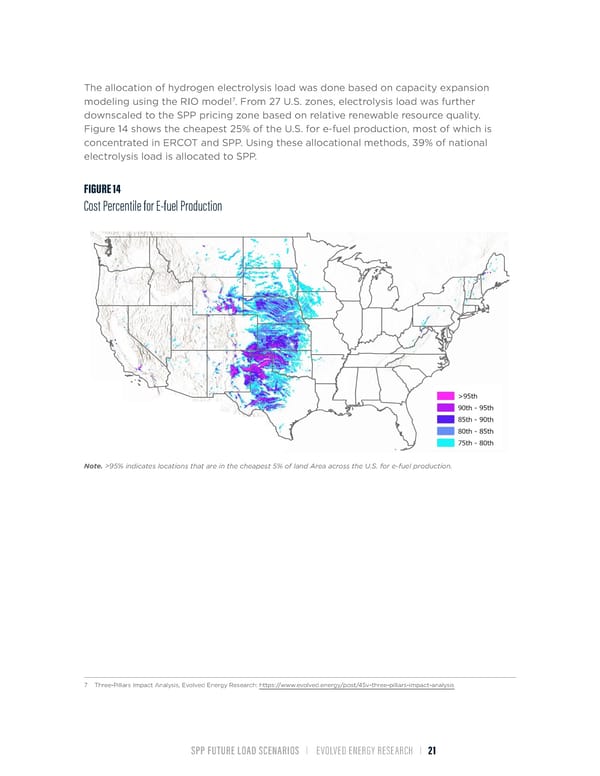
The allocation of hydrogen electrolysis load was done based on capacity expansion 7 modeling using the RIO model . From 27 U.S. zones, electrolysis load was further downscaled to the SPP pricing zone based on relative renewable resource quality. Figure 14 shows the cheapest 25% of the U.S. for e-fuel production, most of which is concentrated in ERCOT and SPP. Using these allocational methods, 39% of national electrolysis load is allocated to SPP. FIGURE 14 Cost Percentile for E-fuel Production Note. >95% indicates locations that are in the cheapest 5% of land Area across the U.S. for e-fuel production. 7 Three-Pillars Impact Analysis, Evolved Energy Research: https://www.evolved.energy/post/45v-three-pillars-impact-analysis SPP FUTURE LOAD SCENARIOS | EVOLVED ENERGY RESEARCH | 21
 Future Load Scenarios for Southwest Power Pool Page 22 Page 24