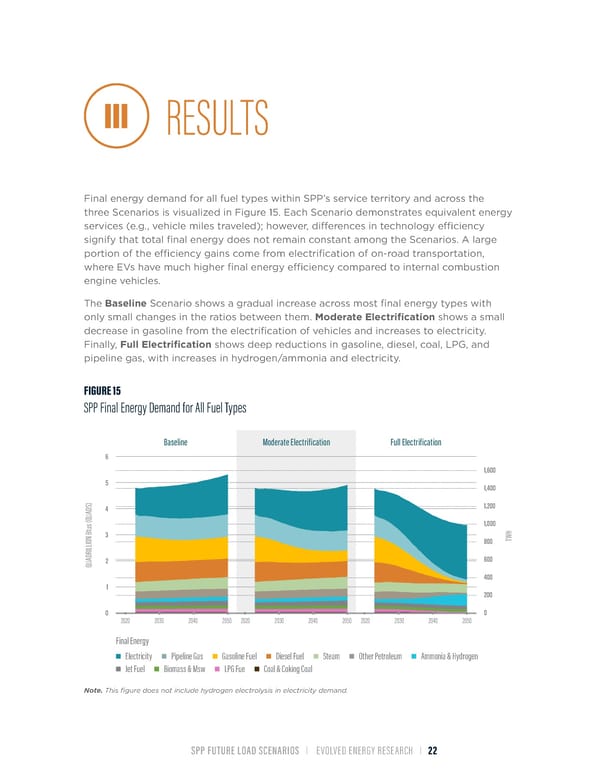
III RESULTS Final energy demand for all fuel types within SPP’s service territory and across the three Scenarios is visualized in Figure 15. Each Scenario demonstrates equivalent energy services (e.g., vehicle miles traveled); however, differences in technology efÏciency signify that total final energy does not remain constant among the Scenarios. A large portion of the efÏciency gains come from electrification of on-road transportation, where EVs have much higher final energy efÏciency compared to internal combustion engine vehicles. The Baseline Scenario shows a gradual increase across most final energy types with only small changes in the ratios between them. Moderate Electrification shows a small decrease in gasoline from the electrification of vehicles and increases to electricity. Finally, Full Electrification shows deep reductions in gasoline, diesel, coal, LPG, and pipeline gas, with increases in hydrogen/ammonia and electricity. FIGURE 15 SPP Final Energy Demand for All Fuel Types Baseline Moderate Electrification Full Electrification 6 1,600 5 1,400 ) S 1,200 D 4 A U Q ( 1,000 us t B 3 WH N 800 T IO L L I DR A 2 600 QU 400 1 200 0 0 2020 2030 2040 2050 2020 2030 2040 2050 2020 2030 2040 2050 Final Energy Electricity Pipeline Gas Gasoline Fuel Diesel Fuel Steam Other Petroleum Ammonia & Hydrogen Jet Fuel Biomass & Msw LPG Fue Coal & Coking Coal Note. This figure does not include hydrogen electrolysis in electricity demand. SPP FUTURE LOAD SCENARIOS | EVOLVED ENERGY RESEARCH | 22
 Future Load Scenarios for Southwest Power Pool Page 23 Page 25