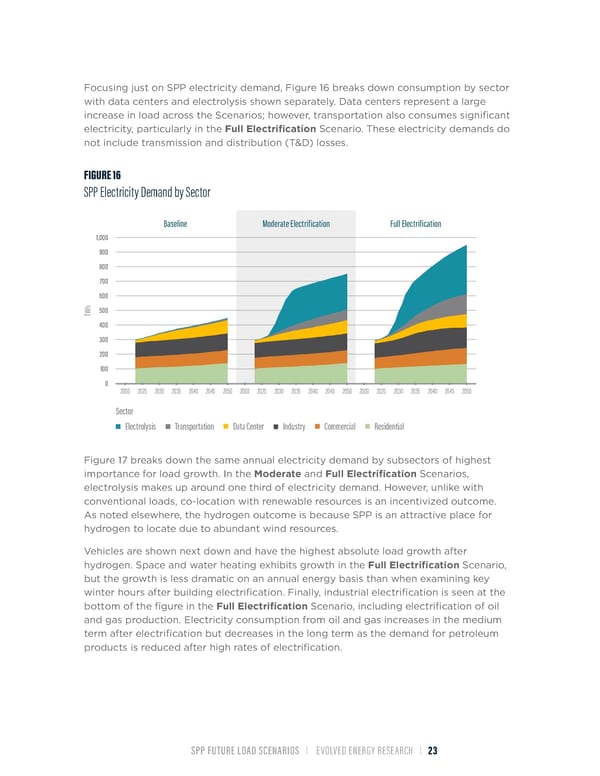
Focusing just on SPP electricity demand, Figure 16 breaks down consumption by sector with data centers and electrolysis shown separately. Data centers represent a large increase in load across the Scenarios; however, transportation also consumes significant electricity, particularly in the Full Electrification Scenario. These electricity demands do not include transmission and distribution (T&D) losses. FIGURE 16 SPP Electricity Demand by Sector Baseline Moderate Electrification Full Electrification 1,000 900 800 700 600 h 500 TW 400 300 200 100 0 2000 2025 2030 2035 2040 2045 2050 2000 2025 2030 2035 2040 2045 2050 2000 2025 2030 2035 2040 2045 2050 Sector Electrolysis Transportation Data Center Industry Commercial Residential Figure 17 breaks down the same annual electricity demand by subsectors of highest importance for load growth. In the Moderate and Full Electrification Scenarios, electrolysis makes up around one third of electricity demand. However, unlike with conventional loads, co-location with renewable resources is an incentivized outcome. As noted elsewhere, the hydrogen outcome is because SPP is an attractive place for hydrogen to locate due to abundant wind resources. Vehicles are shown next down and have the highest absolute load growth after hydrogen. Space and water heating exhibits growth in the Full Electrification Scenario, but the growth is less dramatic on an annual energy basis than when examining key winter hours after building electrification. Finally, industrial electrification is seen at the bottom of the figure in the Full Electrification Scenario, including electrification of oil and gas production. Electricity consumption from oil and gas increases in the medium term after electrification but decreases in the long term as the demand for petroleum products is reduced after high rates of electrification. SPP FUTURE LOAD SCENARIOS | EVOLVED ENERGY RESEARCH | 23
 Future Load Scenarios for Southwest Power Pool Page 24 Page 26