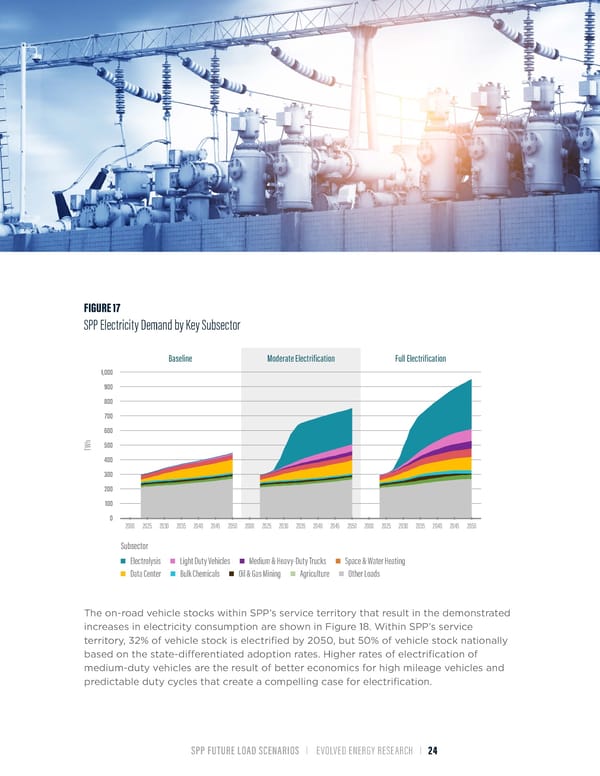
FIGURE 17 SPP Electricity Demand by Key Subsector Baseline Moderate Electrification Full Electrification 1,000 900 800 700 600 h 500 TW 400 300 200 100 0 2000 2025 2030 2035 2040 2045 2050 2000 2025 2030 2035 2040 2045 2050 2000 2025 2030 2035 2040 2045 2050 Subsector Electrolysis Light Duty Vehicles Medium & Heavy-Duty Trucks Space & Water Heating Data Center Bulk Chemicals Oil & Gas Mining Agriculture Other Loads The on-road vehicle stocks within SPP’s service territory that result in the demonstrated increases in electricity consumption are shown in Figure 18. Within SPP’s service territory, 32% of vehicle stock is electrified by 2050, but 50% of vehicle stock nationally based on the state-differentiated adoption rates. Higher rates of electrification of medium-duty vehicles are the result of better economics for high mileage vehicles and predictable duty cycles that create a compelling case for electrification. SPP FUTURE LOAD SCENARIOS | EVOLVED ENERGY RESEARCH | 24
 Future Load Scenarios for Southwest Power Pool Page 25 Page 27