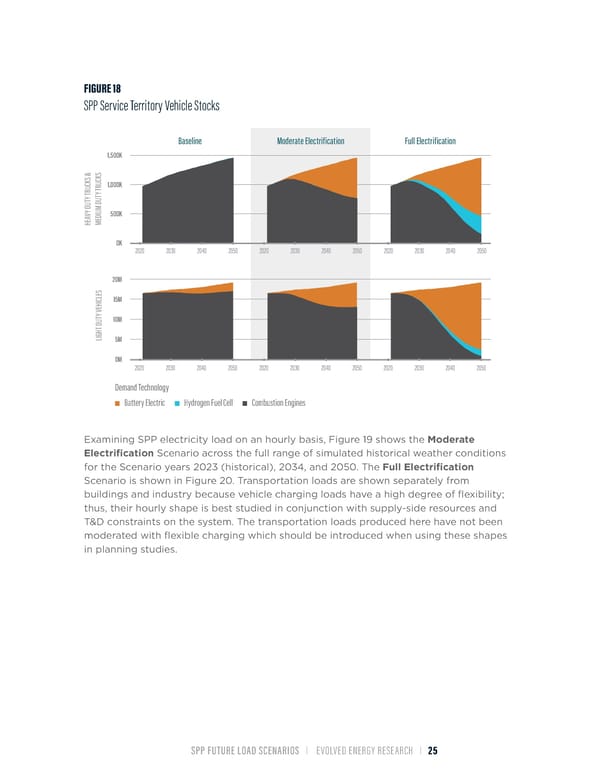
FIGURE 18 SPP Service Territory Vehicle Stocks Baseline Moderate Electrification Full Electrification 1,500K S S & K K C C U 1,000K U R R Y T Y T T T U U M D Y D IU 500K V D A HE ME 0K 2020 2030 2040 2050 2020 2030 2040 2050 2020 2030 2040 2050 20M S E L C 15M HI E Y V T 10M U T D H G I L 5M 0M 2020 2030 2040 2050 2020 2030 2040 2050 2020 2030 2040 2050 Demand Technology Battery Electric Hydrogen Fuel Cell Combustion Engines Examining SPP electricity load on an hourly basis, Figure 19 shows the Moderate Electrification Scenario across the full range of simulated historical weather conditions for the Scenario years 2023 (historical), 2034, and 2050. The Full Electrification Scenario is shown in Figure 20. Transportation loads are shown separately from buildings and industry because vehicle charging loads have a high degree of flexibility; thus, their hourly shape is best studied in conjunction with supply-side resources and T&D constraints on the system. The transportation loads produced here have not been moderated with flexible charging which should be introduced when using these shapes in planning studies. SPP FUTURE LOAD SCENARIOS | EVOLVED ENERGY RESEARCH | 25
 Future Load Scenarios for Southwest Power Pool Page 26 Page 28