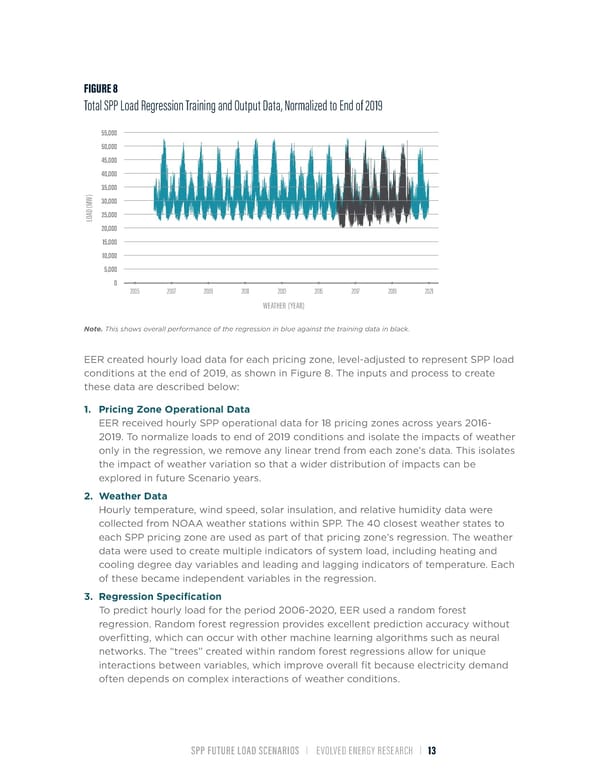
FIGURE 8 Total SPP Load Regression Training and Output Data, Normalized to End of 2019 55,000 50,000 45,000 40,000 35,000 ) W30,000 M ( D A25,000 O L 20,000 15,000 10,000 5,000 0 2005 2007 2009 2011 2013 2015 2017 2019 2021 WEATHER (YEAR) Note. This shows overall performance of the regression in blue against the training data in black. EER created hourly load data for each pricing zone, level-adjusted to represent SPP load conditions at the end of 2019, as shown in Figure 8. The inputs and process to create these data are described below: 1. Pricing Zone Operational Data EER received hourly SPP operational data for 18 pricing zones across years 2016- 2019. To normalize loads to end of 2019 conditions and isolate the impacts of weather only in the regression, we remove any linear trend from each zone’s data. This isolates the impact of weather variation so that a wider distribution of impacts can be explored in future Scenario years. 2. Weather Data Hourly temperature, wind speed, solar insulation, and relative humidity data were collected from NOAA weather stations within SPP. The 40 closest weather states to each SPP pricing zone are used as part of that pricing zone’s regression. The weather data were used to create multiple indicators of system load, including heating and cooling degree day variables and leading and lagging indicators of temperature. Each of these became independent variables in the regression. 3. Regression Specification To predict hourly load for the period 2006-2020, EER used a random forest regression. Random forest regression provides excellent prediction accuracy without overfitting, which can occur with other machine learning algorithms such as neural networks. The “trees” created within random forest regressions allow for unique interactions between variables, which improve overall fit because electricity demand often depends on complex interactions of weather conditions. SPP FUTURE LOAD SCENARIOS | EVOLVED ENERGY RESEARCH | 13
 Future Load Scenarios for Southwest Power Pool Page 14 Page 16