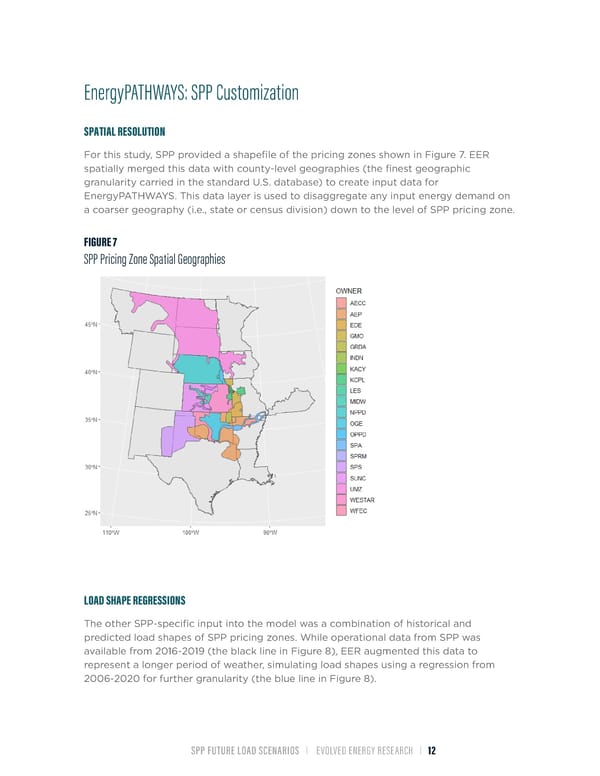
EnergyPATHWAYS: SPP Customization SPATIAL RESOLUTION For this study, SPP provided a shapefile of the pricing zones shown in Figure 7. EER spatially merged this data with county-level geographies (the finest geographic granularity carried in the standard U.S. database) to create input data for EnergyPATHWAYS. This data layer is used to disaggregate any input energy demand on a coarser geography (i.e., state or census division) down to the level of SPP pricing zone. FIGURE 7 SPP Pricing Zone Spatial Geographies LOAD SHAPE REGRESSIONS The other SPP-specific input into the model was a combination of historical and predicted load shapes of SPP pricing zones. While operational data from SPP was available from 2016-2019 (the black line in Figure 8), EER augmented this data to represent a longer period of weather, simulating load shapes using a regression from 2006-2020 for further granularity (the blue line in Figure 8). SPP FUTURE LOAD SCENARIOS | EVOLVED ENERGY RESEARCH | 12
 Future Load Scenarios for Southwest Power Pool Page 13 Page 15