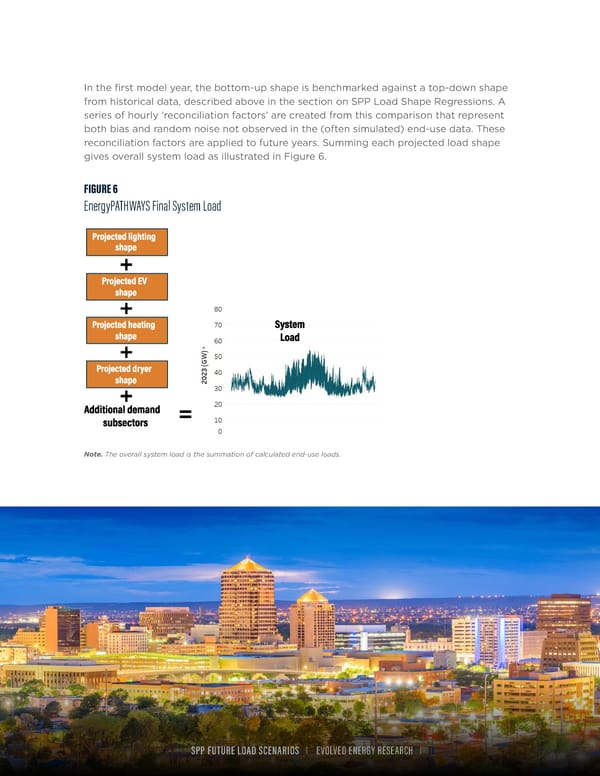
In the first model year, the bottom-up shape is benchmarked against a top-down shape from historical data, described above in the section on SPP Load Shape Regressions. A series of hourly ‘reconciliation factors’ are created from this comparison that represent both bias and random noise not observed in the (often simulated) end-use data. These reconciliation factors are applied to future years. Summing each projected load shape gives overall system load as illustrated in Figure 6. FIGURE 6 EnergyPATHWAYS Final System Load Note. The overall system load is the summation of calculated end-use loads. SPP FUTURE LOAD SCENARIOS | EVOLVED ENERGY RESEARCH | 11
 Future Load Scenarios for Southwest Power Pool Page 12 Page 14