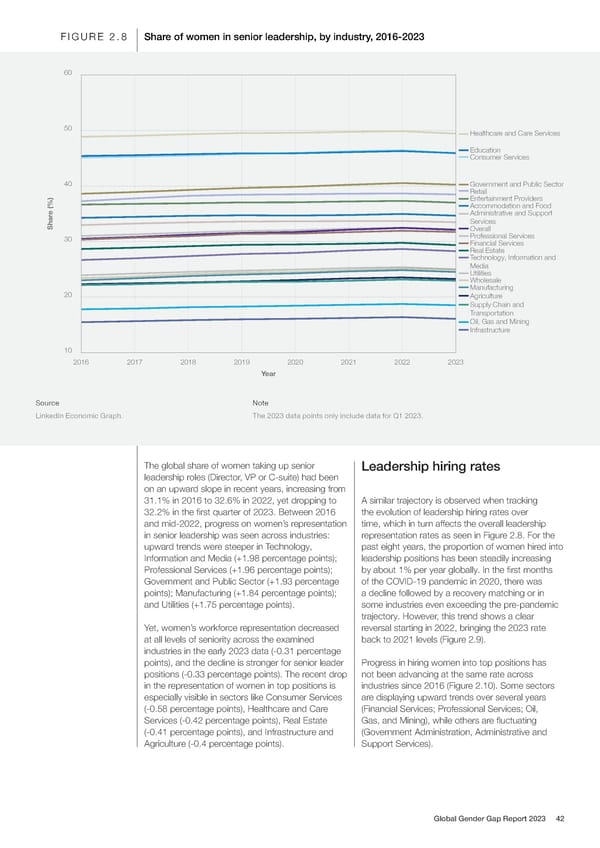
FIGURE 2.8 Share of women in senior leadership, by industry, 2016-2023 60 50 Healthcare and Care Services Education Consumer Services 40 Government and Public Sector Retail Entertainment Providers e (%) Accommodation and Food Administrative and Support Shar Services Overall 30 Professional Services Financial Services Real Estate Technology, Information and Media Utilities Wholesale Manufacturing 20 Agriculture Supply Chain and Transportation Oil, Gas and Mining Infrastructure 10 2016 2017 2018 2019 2020 2021 2022 2023 Year Source Note LinkedIn Economic Graph. The 2023 data points only include data for Q1 2023. The global share of women taking up senior Leadership hiring rates leadership roles (Director, VP or C-suite) had been on an upward slope in recent years, increasing from 31.1% in 2016 to 32.6% in 2022, yet dropping to A similar trajectory is observed when tracking 32.2% in the 昀椀rst quarter of 2023. Between 2016 the evolution of leadership hiring rates over and mid-2022, progress on women’s representation time, which in turn affects the overall leadership in senior leadership was seen across industries: representation rates as seen in Figure 2.8. For the upward trends were steeper in Technology, past eight years, the proportion of women hired into Information and Media (+1.98 percentage points); leadership positions has been steadily increasing Professional Services (+1.96 percentage points); by about 1% per year globally. In the 昀椀rst months Government and Public Sector (+1.93 percentage of the COVID-19 pandemic in 2020, there was points); Manufacturing (+1.84 percentage points); a decline followed by a recovery matching or in and Utilities (+1.75 percentage points). some industries even exceeding the pre-pandemic trajectory. However, this trend shows a clear Yet, women’s workforce representation decreased reversal starting in 2022, bringing the 2023 rate at all levels of seniority across the examined back to 2021 levels (Figure 2.9). industries in the early 2023 data (-0.31 percentage points), and the decline is stronger for senior leader Progress in hiring women into top positions has positions (-0.33 percentage points). The recent drop not been advancing at the same rate across in the representation of women in top positions is industries since 2016 (Figure 2.10). Some sectors especially visible in sectors like Consumer Services are displaying upward trends over several years (-0.58 percentage points), Healthcare and Care (Financial Services; Professional Services; Oil, Services (-0.42 percentage points), Real Estate Gas, and Mining), while others are 昀氀uctuating (-0.41 percentage points), and Infrastructure and (Government Administration, Administrative and Agriculture (-0.4 percentage points). Support Services). Global Gender Gap Report 2023 42
 Global Gender Gap Report 2023 Page 41 Page 43