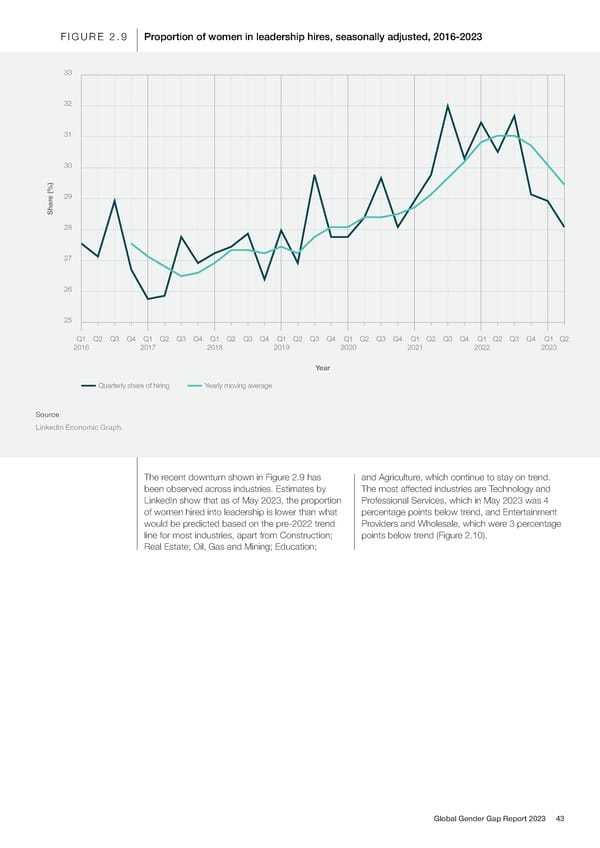
FIGURE 2.9 Proportion of women in leadership hires, seasonally adjusted, 2016-2023 33 32 31 30 e (%)29 Shar 28 27 26 25 Q1 Q2 Q3 Q4 Q1 Q2 Q3 Q4 Q1 Q2 Q3 Q4 Q1 Q2 Q3 Q4 Q1 Q2 Q3 Q4 Q1 Q2 Q3 Q4 Q1 Q2 Q3 Q4 Q1 Q2 2016 2017 2018 2019 2020 2021 2022 2023 Year Quarterly share of hiring Yearly moving average Source LinkedIn Economic Graph. The recent downturn shown in Figure 2.9 has and Agriculture, which continue to stay on trend. been observed across industries. Estimates by The most affected industries are Technology and LinkedIn show that as of May 2023, the proportion Professional Services, which in May 2023 was 4 of women hired into leadership is lower than what percentage points below trend, and Entertainment would be predicted based on the pre-2022 trend Providers and Wholesale, which were 3 percentage line for most industries, apart from Construction; points below trend (Figure 2.10). Real Estate; Oil, Gas and Mining; Education; Global Gender Gap Report 2023 43
 Global Gender Gap Report 2023 Page 42 Page 44