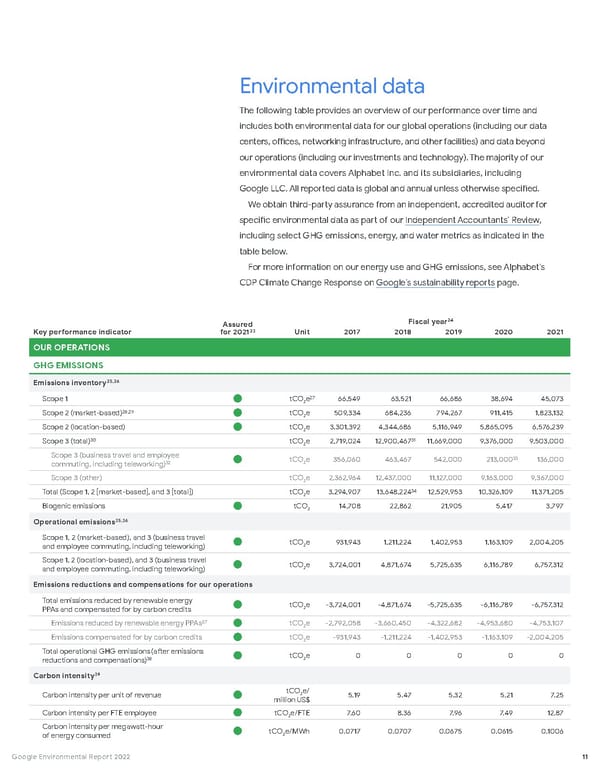
Key performance indicator Assured for 2021 23 Unit Fiscal year 24 2017 2018 2019 2020 2021 OUR OPERATIONS GHG EMISSIONS Emissions inventory 25 , 26 Scope 1 tCO 2 e 27 66,549 63,521 66,686 38,694 45,073 Scope 2 (market-based) 28 , 29 tCO 2 e 509,334 684,236 794,267 911,415 1,823,132 Scope 2 (location-based) tCO 2 e 3,301,392 4,344,686 5,116,949 5,865,095 6,576,239 Scope 3 (total) 30 tCO 2 e 2,719,024 12,900,467 31 11,669,000 9,376,000 9,503,000 Scope 3 (business travel and employee commuting, including teleworking) 32 tCO 2 e 356,060 463,467 542,000 213,000 33 136,000 Scope 3 (other) tCO 2 e 2,362,964 12,437,000 11,127,000 9,163,000 9,367,000 Total (Scope 1, 2 [market-based], and 3 [total]) tCO 2 e 3,294,907 13,648,224 34 12,529,953 10,326,109 11,371,205 Biogenic emissions tCO 2 14,708 22,862 21,905 5,417 3,797 Operational emissions 35 , 36 Scope 1, 2 (market-based), and 3 (business travel and employee commuting, including teleworking) tCO 2 e 931,943 1,211,224 1,402,953 1,163,109 2,004,205 Scope 1, 2 (location-based), and 3 (business travel and employee commuting, including teleworking) tCO 2 e 3,724,001 4,871,674 5,725,635 6,116,789 6,757,312 Emissions reductions and compensations for our operations Total emissions reduced by renewable energy PPAs and compensated for by carbon credits tCO 2 e -3,724,001 -4,871,674 -5,725,635 -6,116,789 -6,757,312 Emissions reduced by renewable energy PPAs 37 tCO 2 e -2,792,058 -3,660,450 -4,322,682 -4,953,680 -4,753,107 Emissions compensated for by carbon credits tCO 2 e -931,943 -1,211,224 -1,402,953 -1,163,109 -2,004,205 Total operational GHG emissions (after emissions reductions and compensations) 38 tCO 2 e 0 0 0 0 0 Carbon intensity 39 Carbon intensity per unit of revenue tCO 2 e/ million US$ 5.19 5.47 5.32 5.21 7.25 Carbon intensity per FTE employee tCO 2 e/FTE 7.60 8.36 7.96 7.49 12.87 Carbon intensity per megawatt-hour of energy consumed tCO 2 e/MWh 0.0717 0.0707 0.0675 0.0615 0.1006 Environmental data The following table provides an overview of our performance over time and includes both environmental data for our global operations (including our data centers, offices, networking infrastructure, and other facilities) and data beyond our operations (including our investments and technology). The majority of our environmental data covers Alphabet Inc. and its subsidiaries, including Google LLC. All reported data is global and annual unless otherwise specified. We obtain third-party assurance from an independent, accredited auditor for specific environmental data as part of our Independent Accountants’ Review , including select GHG emissions, energy, and water metrics as indicated in the table below. For more information on our energy use and GHG emissions, see Alphabet’s CDP Climate Change Response on Google’s sustainability reports page. 11 Google Environmental Report 2022
 Google Environmental Report Page 11 Page 13