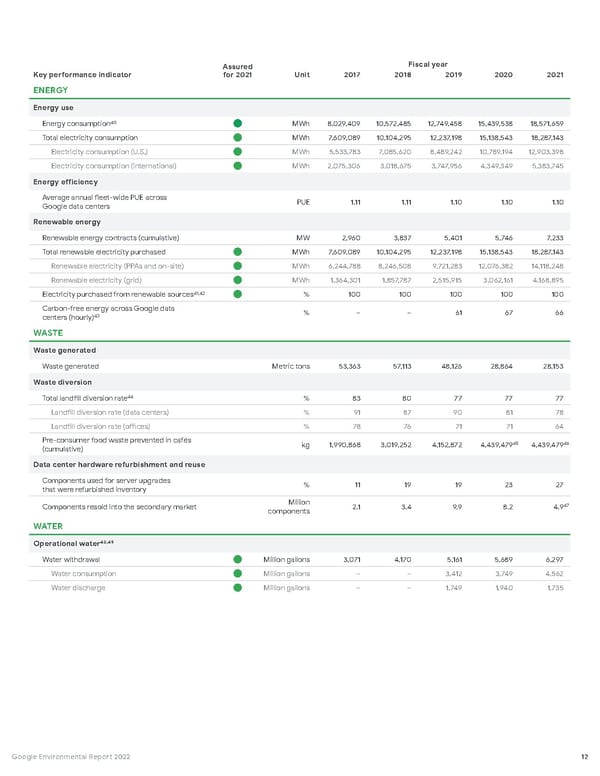
Key performance indicator Assured for 2021 Unit Fiscal year 2017 2018 2019 2020 2021 ENERGY Energy use Energy consumption 40 MWh 8,029,409 10,572,485 12,749,458 15,439,538 18,571,659 Total electricity consumption MWh 7,609,089 10,104,295 12,237,198 15,138,543 18,287,143 Electricity consumption (U.S.) MWh 5,533,783 7,085,620 8,489,242 10,789,194 12,903,398 Electricity consumption (international) MWh 2,075,306 3,018,675 3,747,956 4,349,349 5,383,745 Energy efficiency Average annual fleet-wide PUE across Google data centers PUE 1.11 1.11 1.10 1.10 1.10 Renewable energy Renewable energy contracts (cumulative) MW 2,960 3,837 5,401 5,746 7,233 Total renewable electricity purchased MWh 7,609,089 10,104,295 12,237,198 15,138,543 18,287,143 Renewable electricity (PPAs and on-site) MWh 6,244,788 8,246,508 9,721,283 12,076,382 14,118,248 Renewable electricity (grid) MWh 1,364,301 1,857,787 2,515,915 3,062,161 4,168,895 Electricity purchased from renewable sources 41 , 42 % 100 100 100 100 100 Carbon-free energy across Google data centers (hourly) 43 % – – 61 67 66 WASTE Waste generated Waste generated Metric tons 53,363 57,113 48,126 28,864 28,153 Waste diversion Total landfill diversion rate 44 % 83 80 77 77 77 Landfill diversion rate (data centers) % 91 87 90 81 78 Landfill diversion rate (offices) % 78 76 71 71 64 Pre-consumer food waste prevented in cafés (cumulative) kg 1,990,868 3,019,252 4,152,872 4,439,479 45 4,439,479 46 Data center hardware refurbishment and reuse Components used for server upgrades that were refurbished inventory % 11 19 19 23 27 Components resold into the secondary market Million components 2.1 3.4 9.9 8.2 4.9 47 WATE R Operational water 48 , 49 Water withdrawal Million gallons 3,071 4,170 5,161 5,689 6,297 Water consumption Million gallons – – 3,412 3,749 4,562 Water discharge Million gallons – – 1,749 1,940 1,735 12 Google Environmental Report 2022
 Google Environmental Report Page 12 Page 14